Real-time Data Pipeline
- 1.0 General
- 2.0 Considerations/Limitations
- 3.0 Flood Depth Data Flow Pipeline
- References
1.0 General
1.1 Background
This project uses advanced IoT flood sensors to measure Real-time Flood Depth Data (FDD) on a city-wide scale using industrial grade ultrasonic ranging technology. The ultrasonic rangefinder readings are distance measurements and they are passed through a real-time data pipeline to calculate depth measurements.
1.2 Purpose
The purpose of this document is to explain the Real-time Flood Depth Data pipeline and methodology.
2.0 Considerations/Limitations
This section details the important considerations and limitations of the Flood Depth Data quality.
2.1 Ground truth Validation of Real-time Flood Depth Data
To validate the Real-time Flood Depth Data, the FloodNet researchers have conducted a validation experiment during the event of a flood on the July 23 at 8:30pm in Hamilton Beach. Depth calculation is performed manually by capturing the depth readings using a standard measuring scale that has been installed onto the same pole the sensor has been mounted.
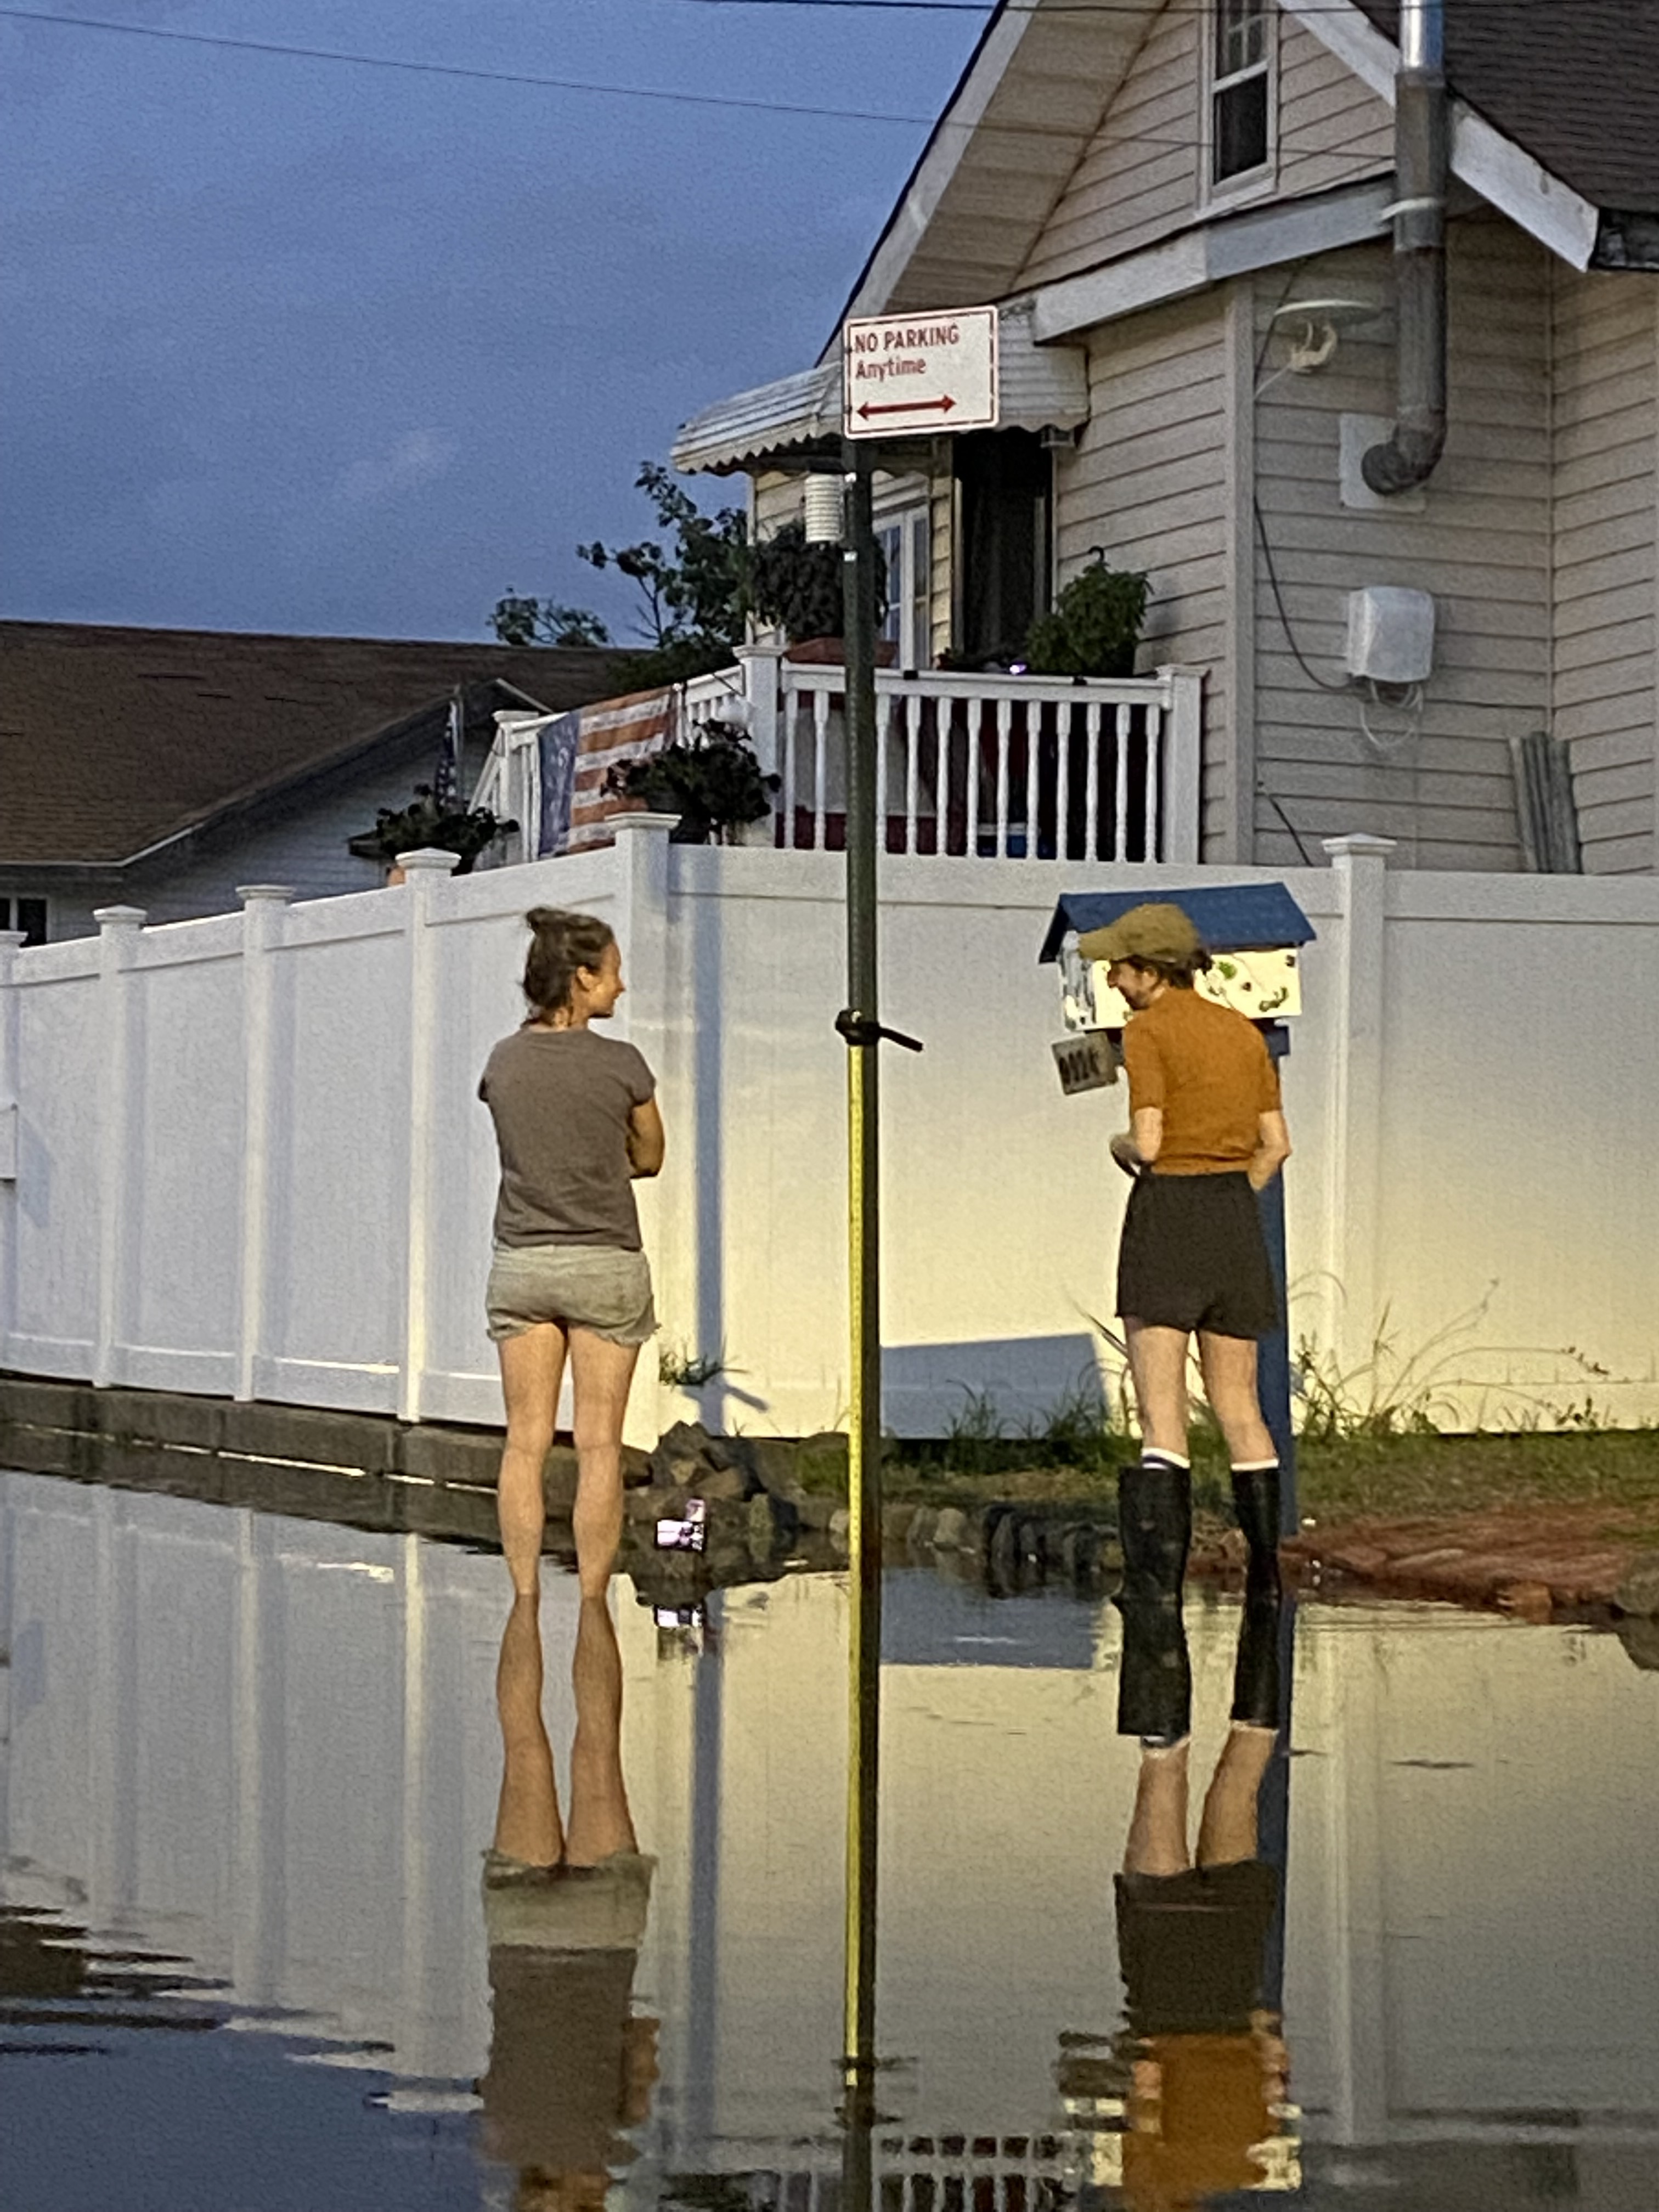
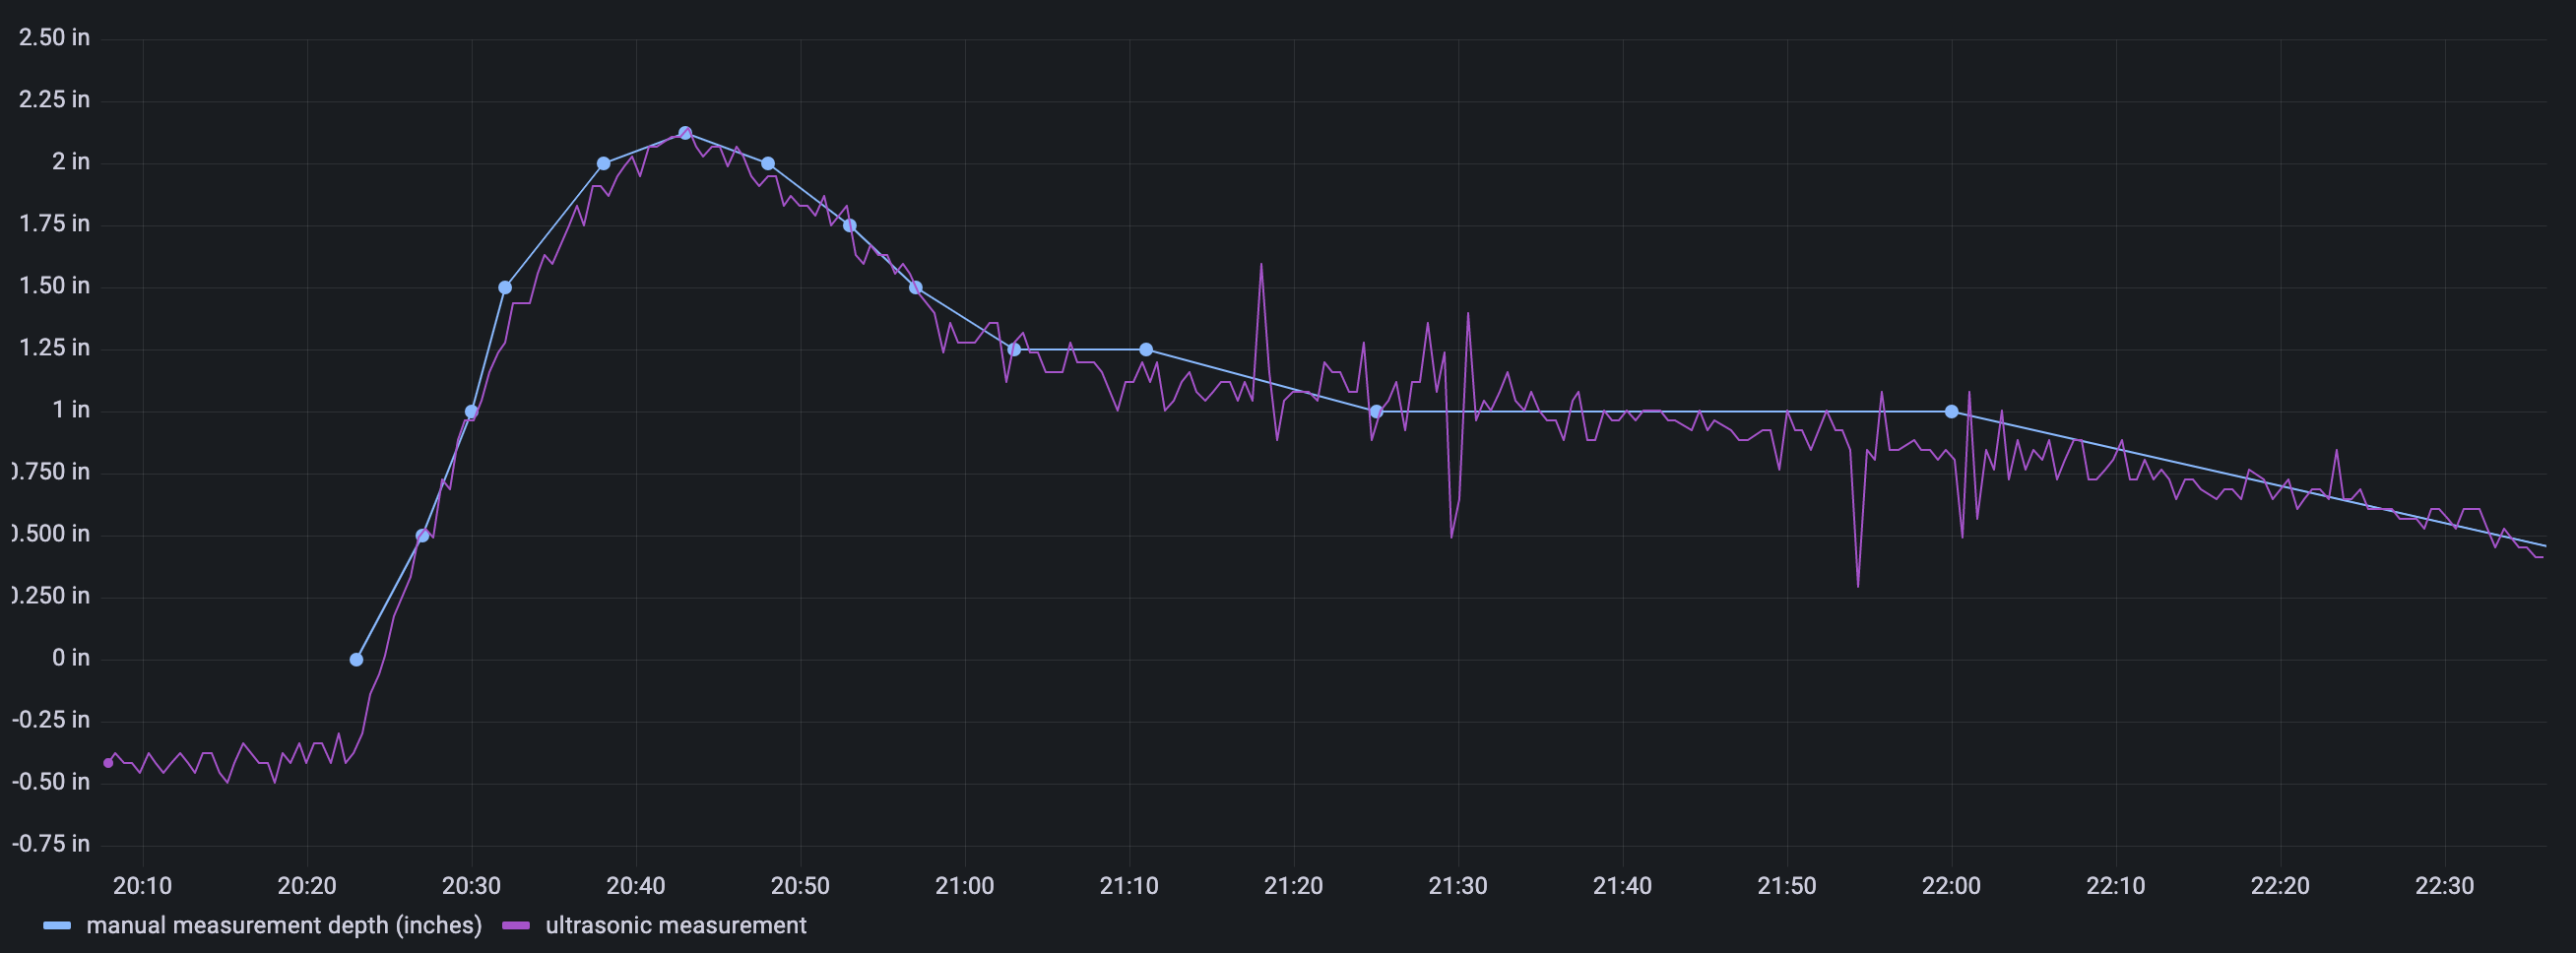
This manually collected data is compared to the depth data the sensor collected in real-time during the event of the flood. The following figure shows the comparison of manual depth captured vs Flood-Depth Data processed from the Data-pipeline. The results verify the validation of the Flood Depth Data captured by the Real-time Flood Monitoring System.
2.2 Sensor Deployment Considerations
2.2.1 Error in Pole Mount Angles
Error in Light pole angles, street sign post angles
2.2.2 Location and Surface
2.2.3 Obstacles
Weeds, dogs, humans, animals
2.3 Hardware Limitations
2.3.1 Accuracy of Ultrasonic Sensor
2.3.2 Noise Floor of Ultrasonic Sensor
2.3.3 Seasonal and Temperature Drift
2.3.4 Influence on Ultrasonic Raw measurements by external factors
3.0 Flood Depth Data Flow Pipeline
3.1 Data Flow Pipeline Overview
The following figure shows the overview of the Data Flow Pipeline:
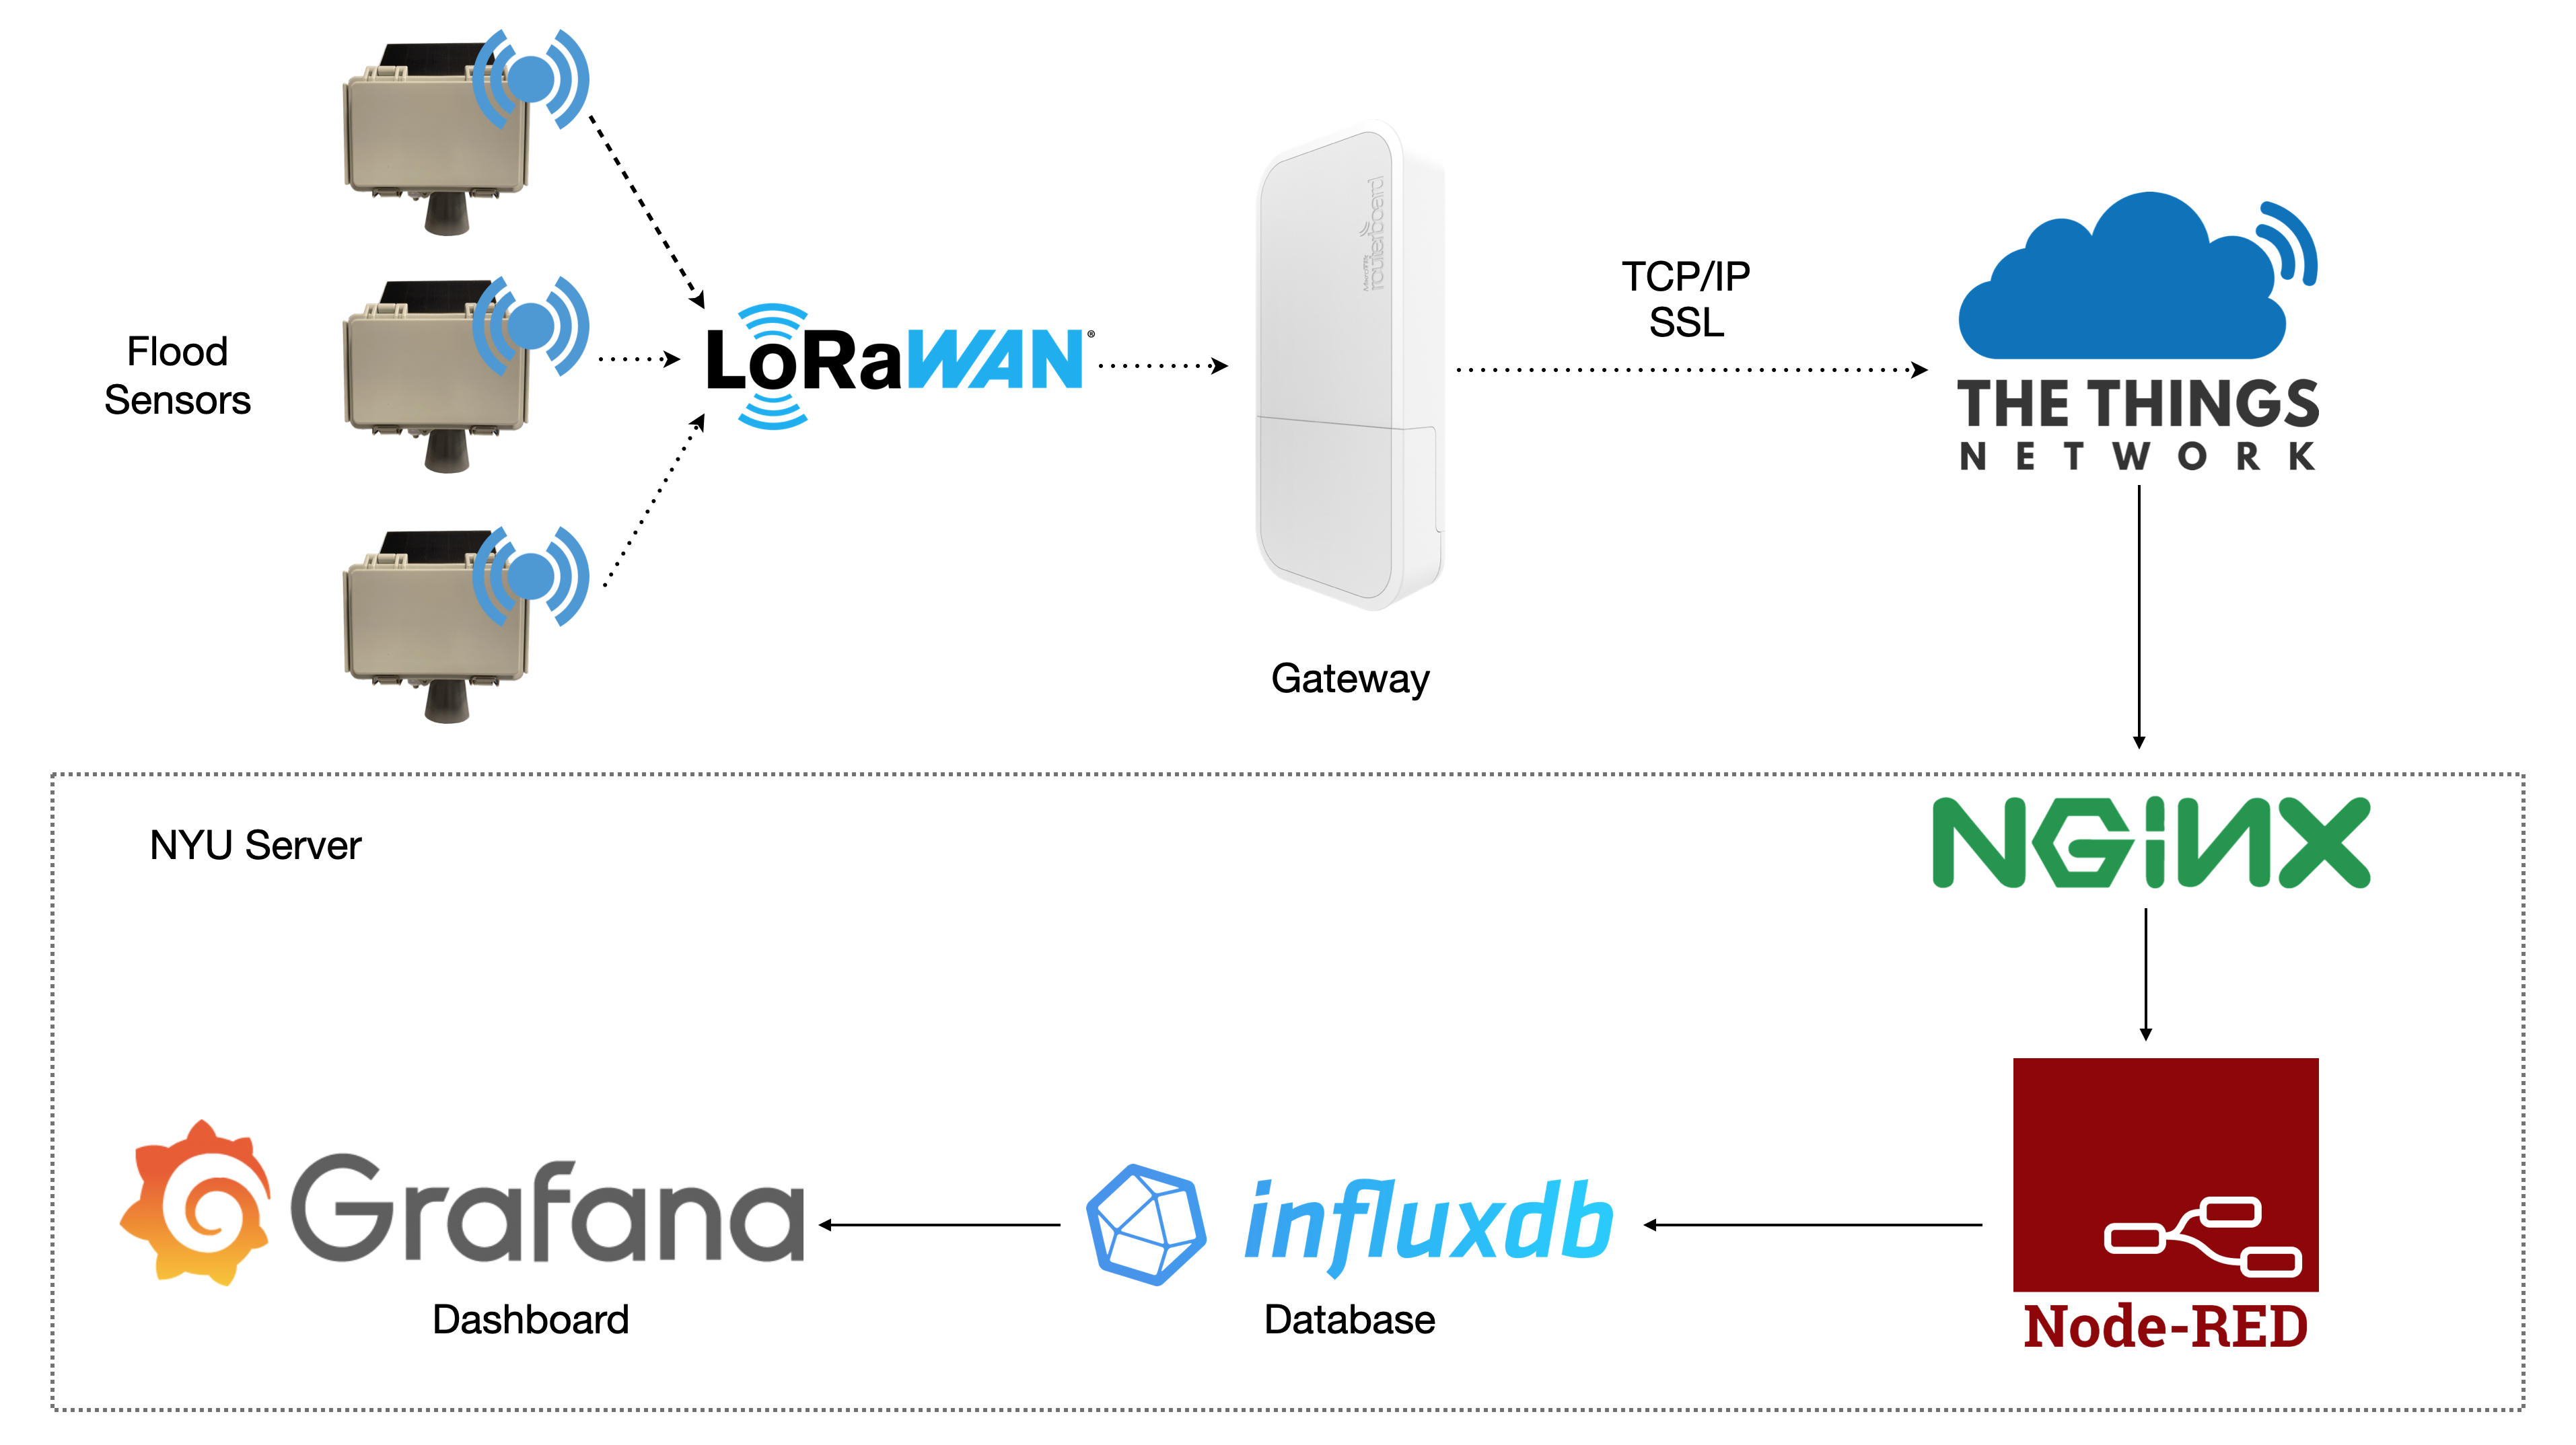
The Flood Sensors transmit the raw data packets over LoRaWAN. These packets are forwarded to a The Things Network (TTN) application via LoRa Gateway. This data is further flows from the TTN into open-source tools hosted on NYU servers for further processing and storage. A combination of docker containers is running a load-balanced web server (NGINX), certificate authority (LetsEncrypt), data routing layer (NodeRed), a database (InfluxDB), and a dashboard platform (Grafana).
The data processing stage takes place on the Node-RED flow, where the raw distance measurements are converted into Flood Depth Data (FDD).
Raw as well as processed data is stored in the InfluxDB database. From there, Grafana handles all the visualization and alerting through its intuitive dashboarding platform.
3.2 Data Processing Methodology
This section explains the data processing methodology implemented in the real-time data pipeline to calculate depth values from the raw data. The following picture demonstrates the flow which every data packet passes through:
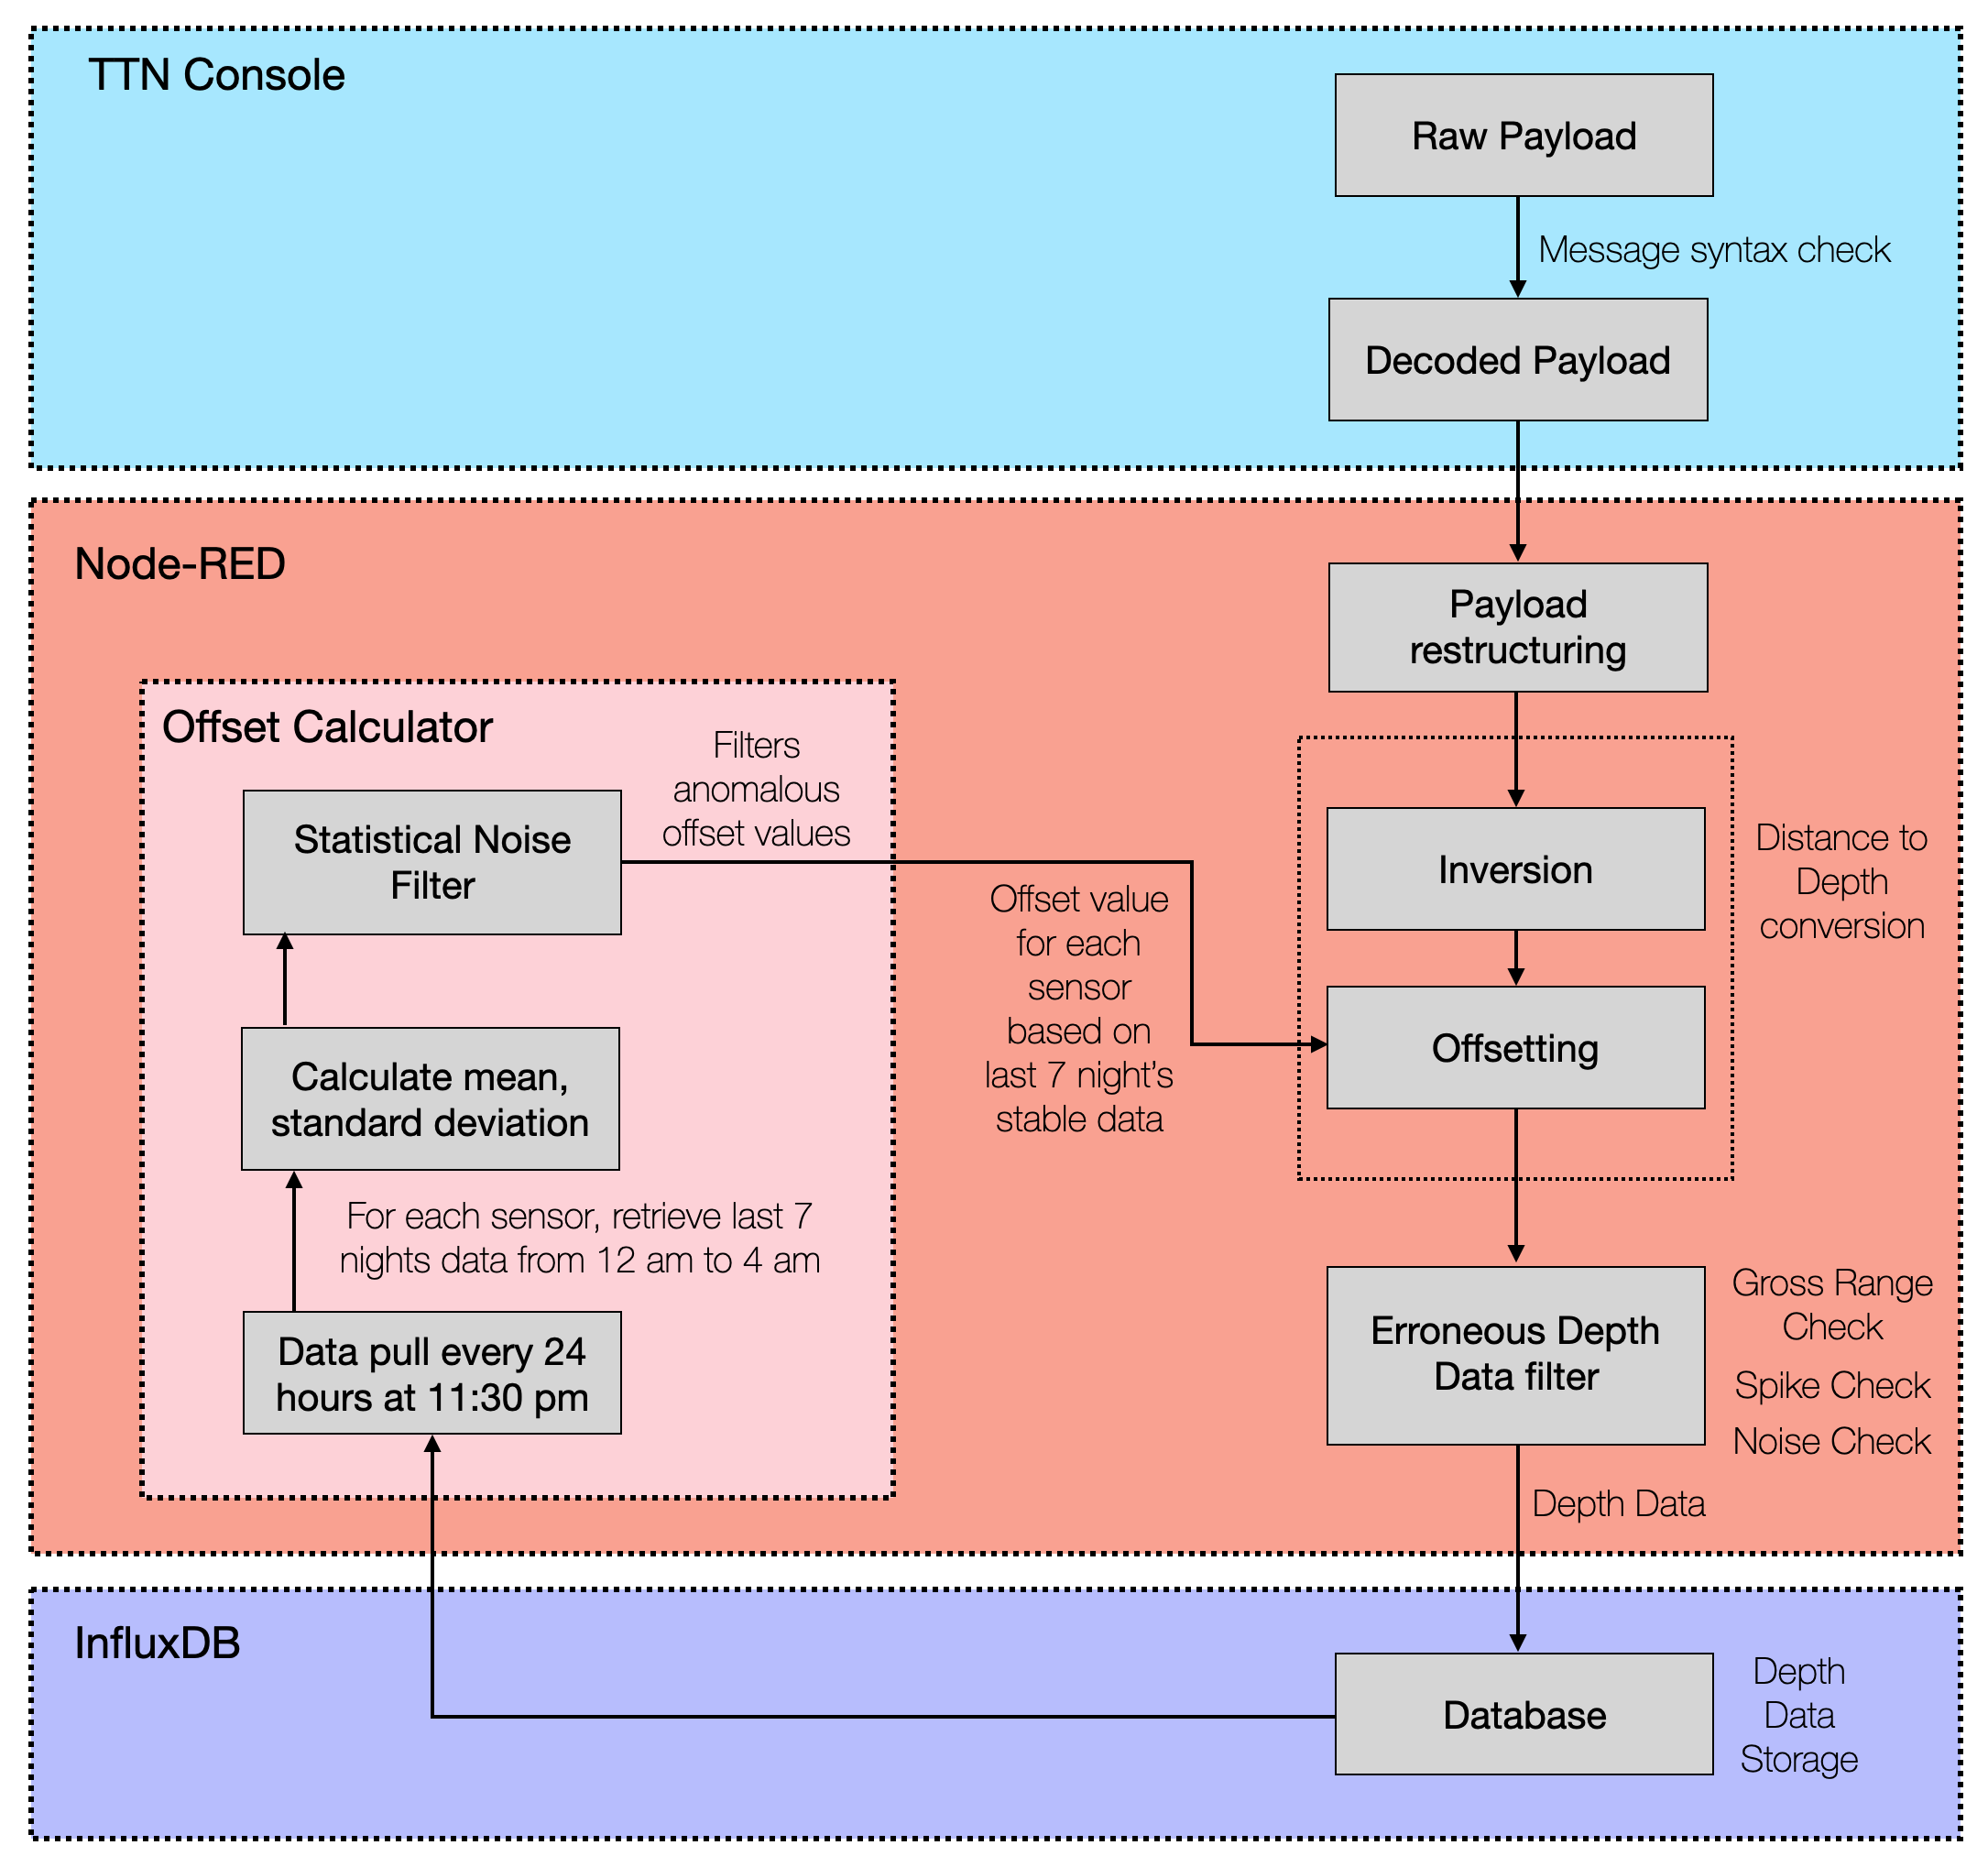
There are three main components where all these stages takes place: TTN Console, Node-Red and InfluxDB. The following sections explain these stages in detail.
Message Syntax Check
Payload decoder has been implemented on the TTN console to verify and decode the raw payload of incoming messages from end-nodes.
Distance to Depth Conversion
Raw measurements of the ultrasonic sensors are distances. Depth measurements are calculated with the application two transformations - Inversion followed by Offsetting. Inversion is multiplying the distance measurements with negative one. Offsetting is adding an offset value to the inverted measurements to obtain depth measurements.
Raw distance measurements:
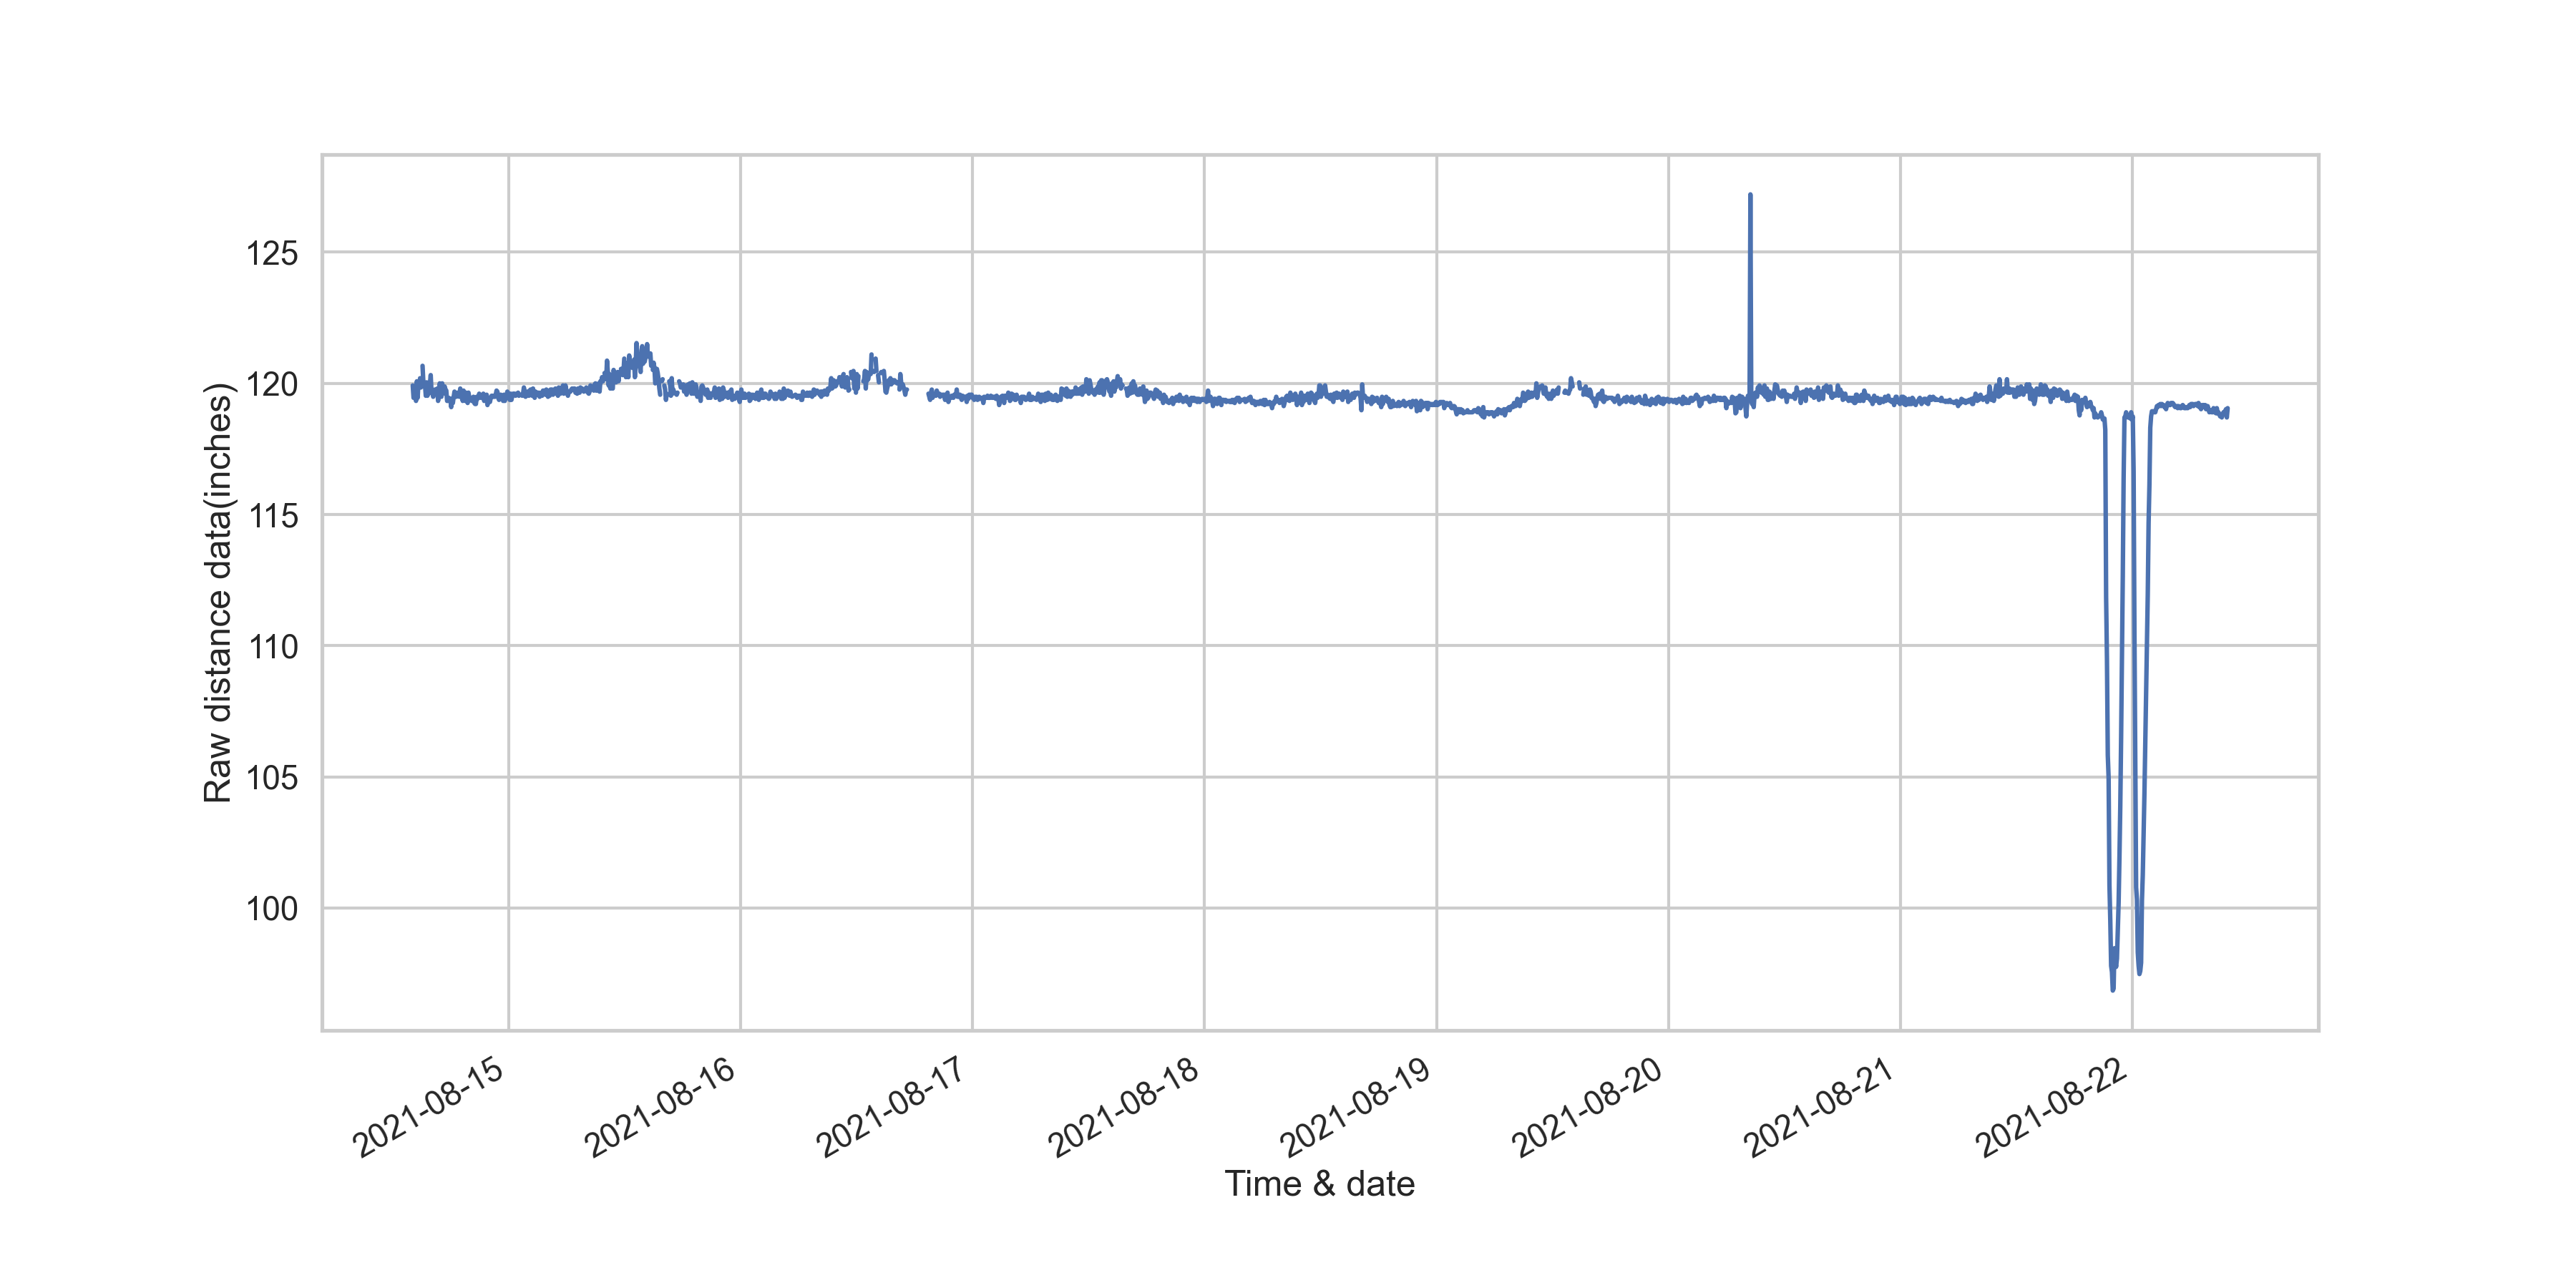
The following figure shows raw distance values of the sensor on Carroll and 4th from 20th August midnight to 22nd August 12:00 pm. Two floods have been captured during the night of 22nd and they correspond to the two spikes in the figure.
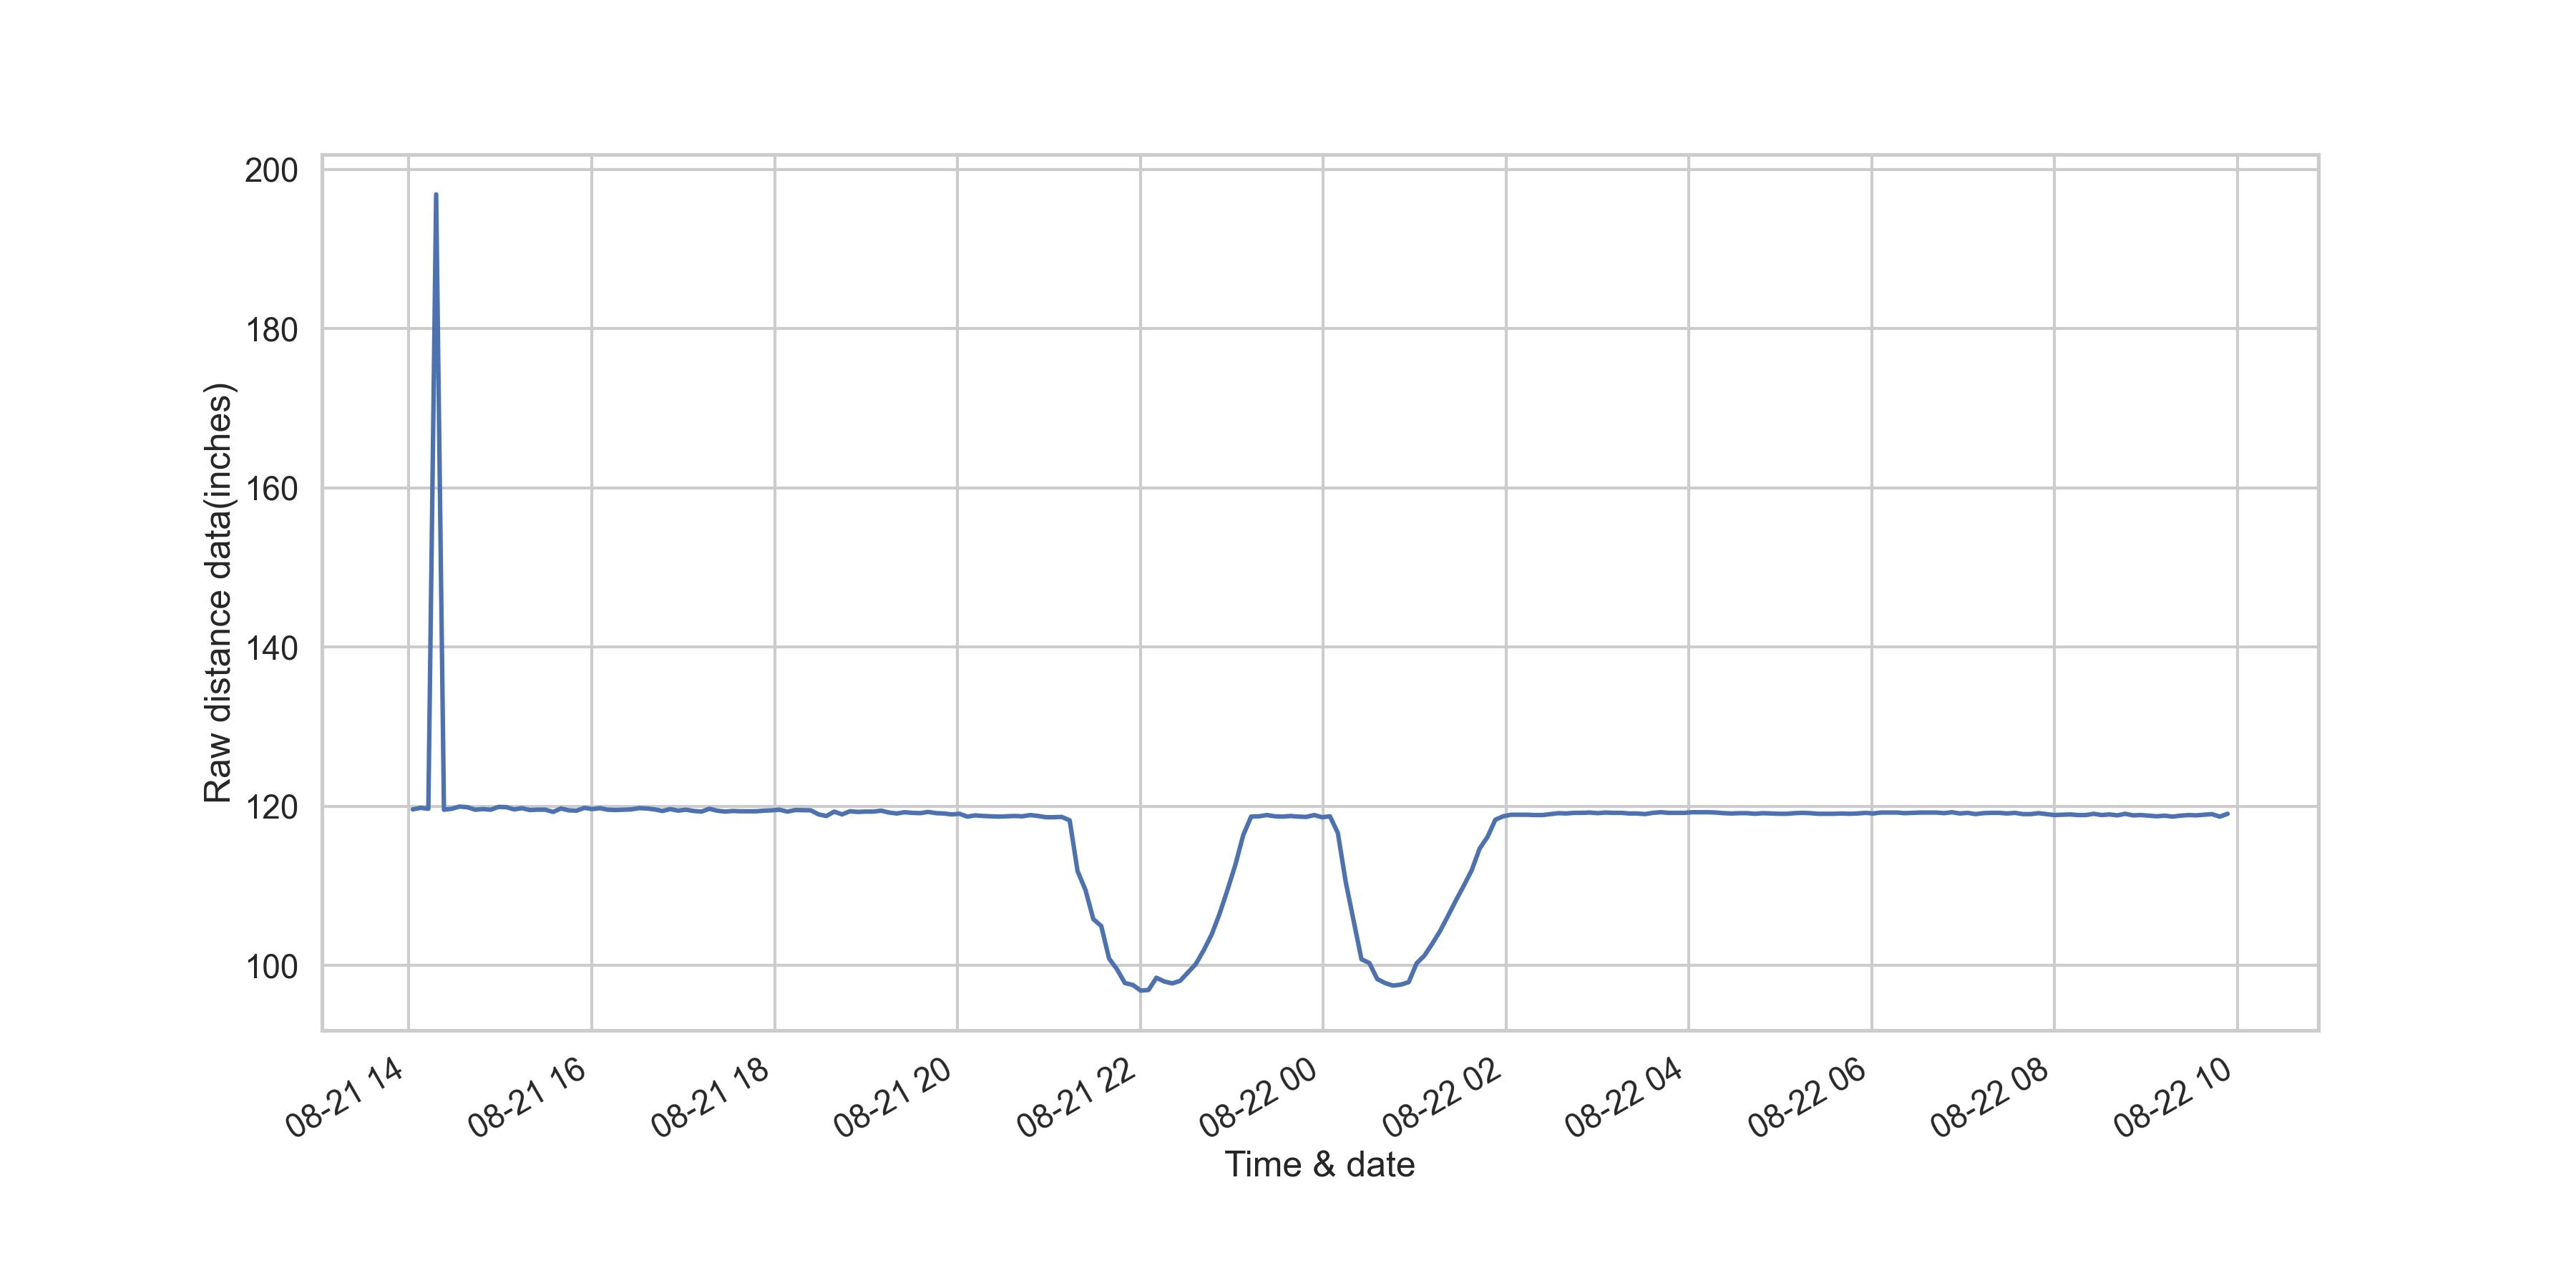
Distance readings are usually the distance between the street sidewalk and the sensor installation height within the noise floor. From the figure it can be observed that this baseline or the most common values when there is no flood is 2.82 meters. But during the time of the flood, the water level is the new surface the sensor detects and as the water level increases upwards, the distance between the sensor and this new surface decreases. Therefore the spikes are downwards.
Inversion:
As the water level increases during the flood, the distance readings between the sensor and this raising water level decreases. Thereby, inverting the measurements is more intuitive as the floods captured are now upwards and has the same profile as the actual flood.
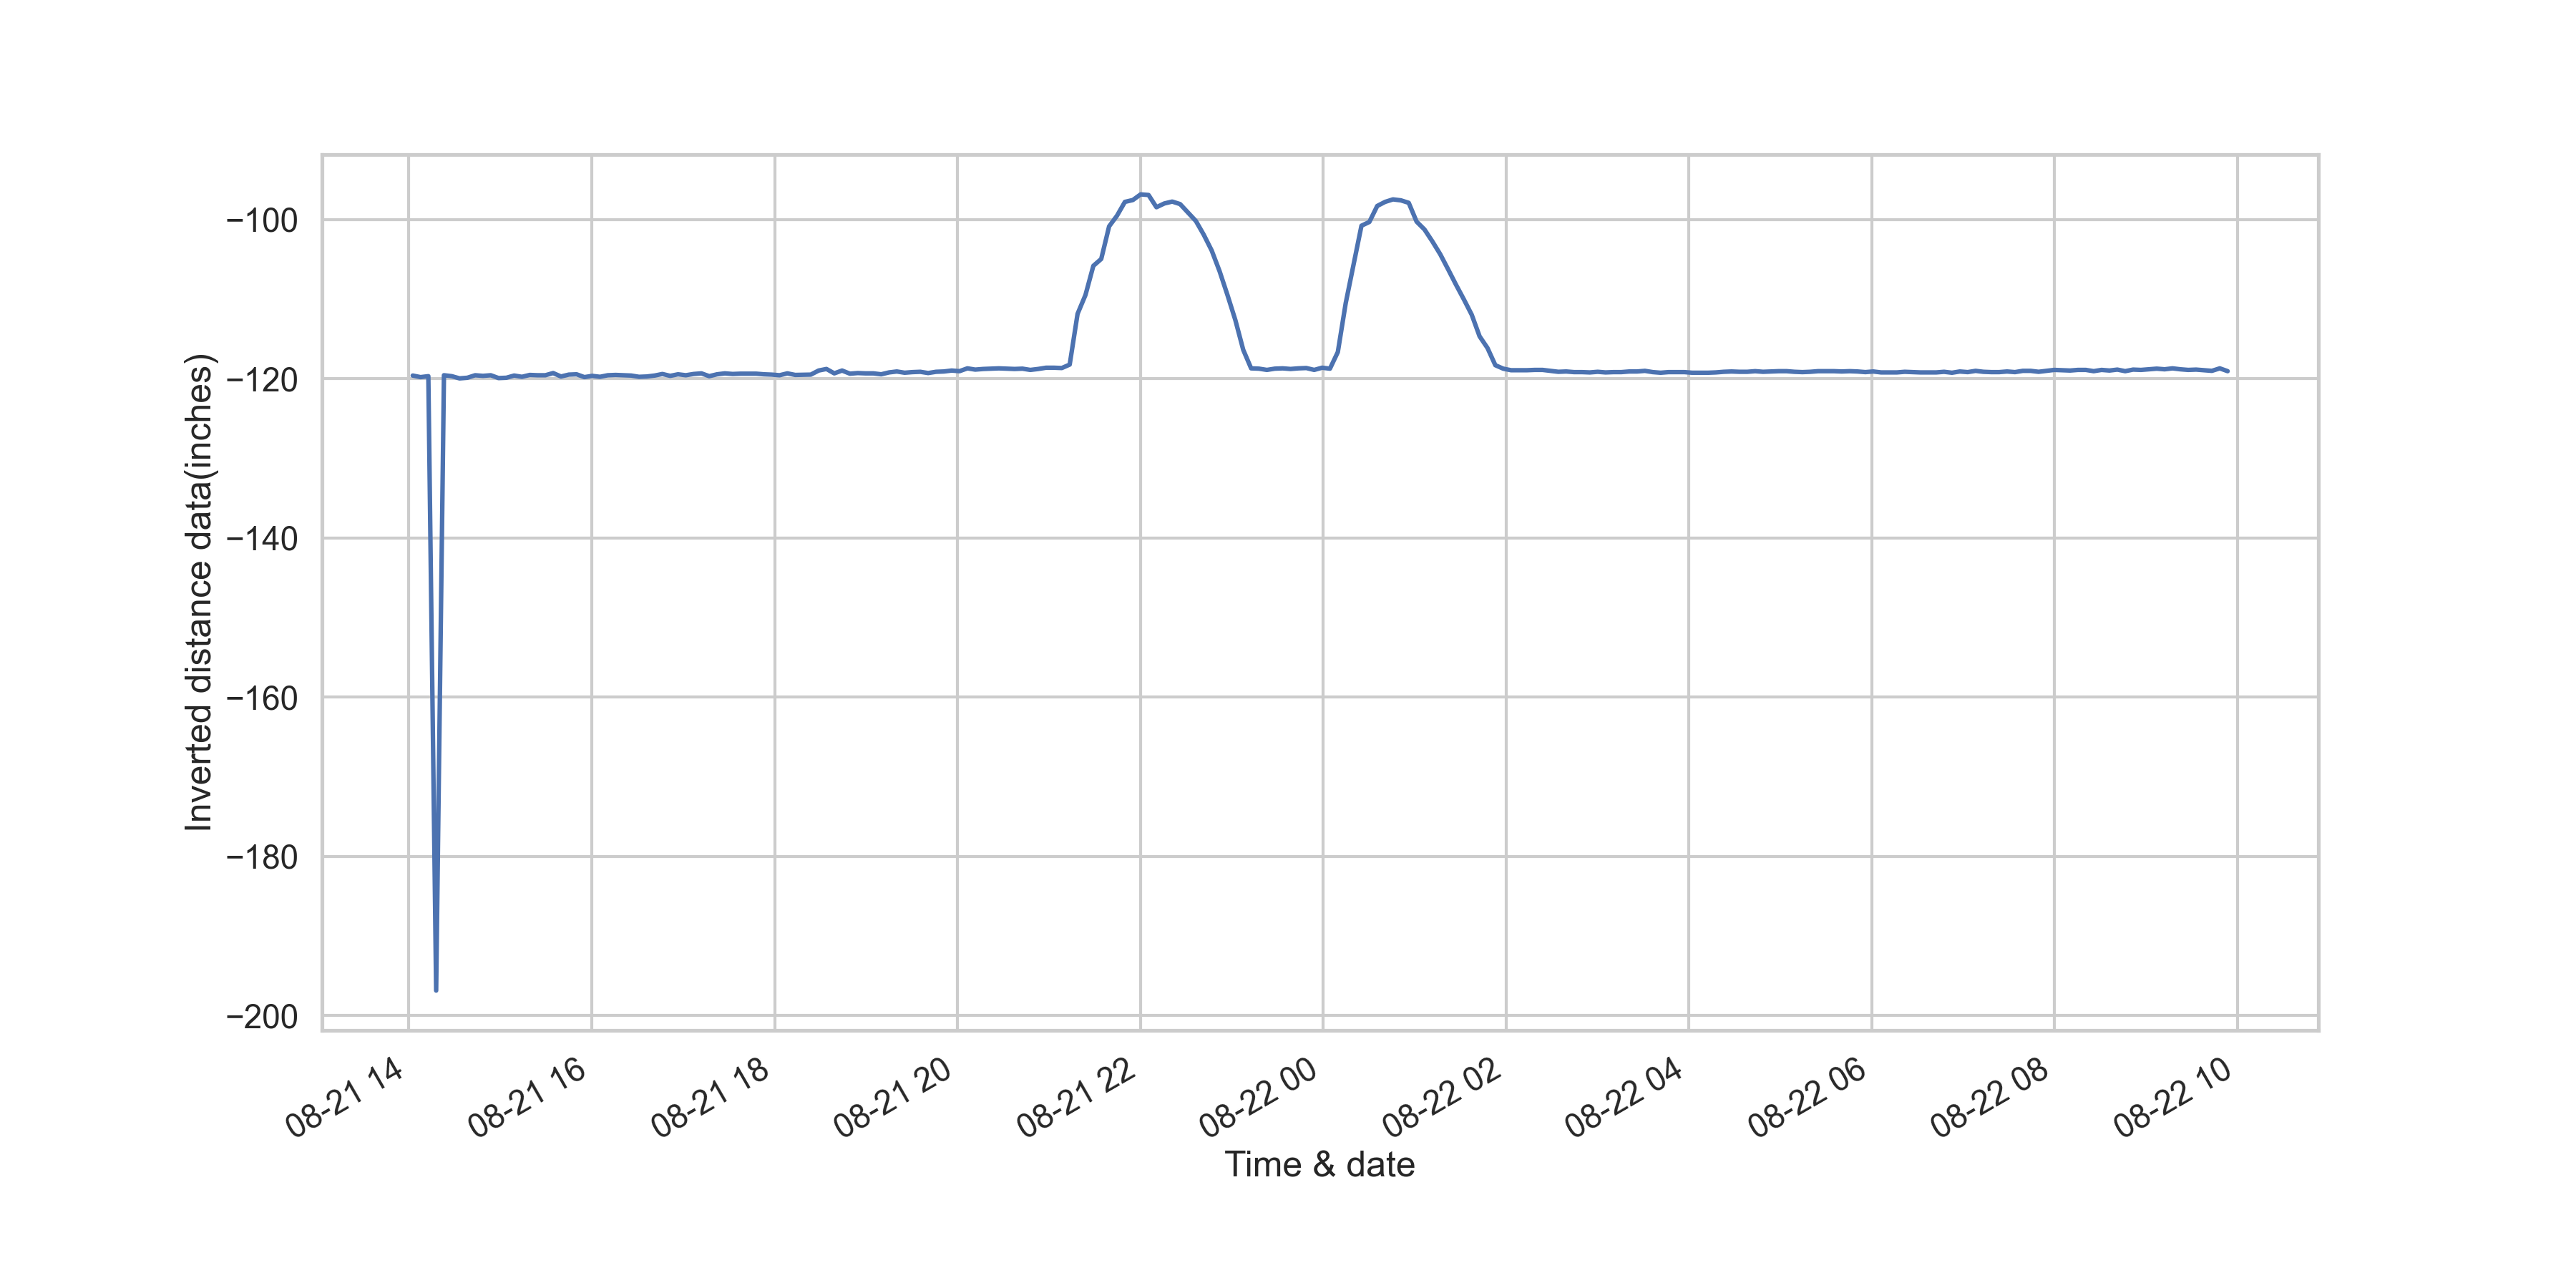
However these are not depth measurements yet as they are at an offset.
Offsetting:
After inversion, an offset value is calculated and added to obtain depth values. This offset is calculated by using the median of the past 7 day’s stable data.
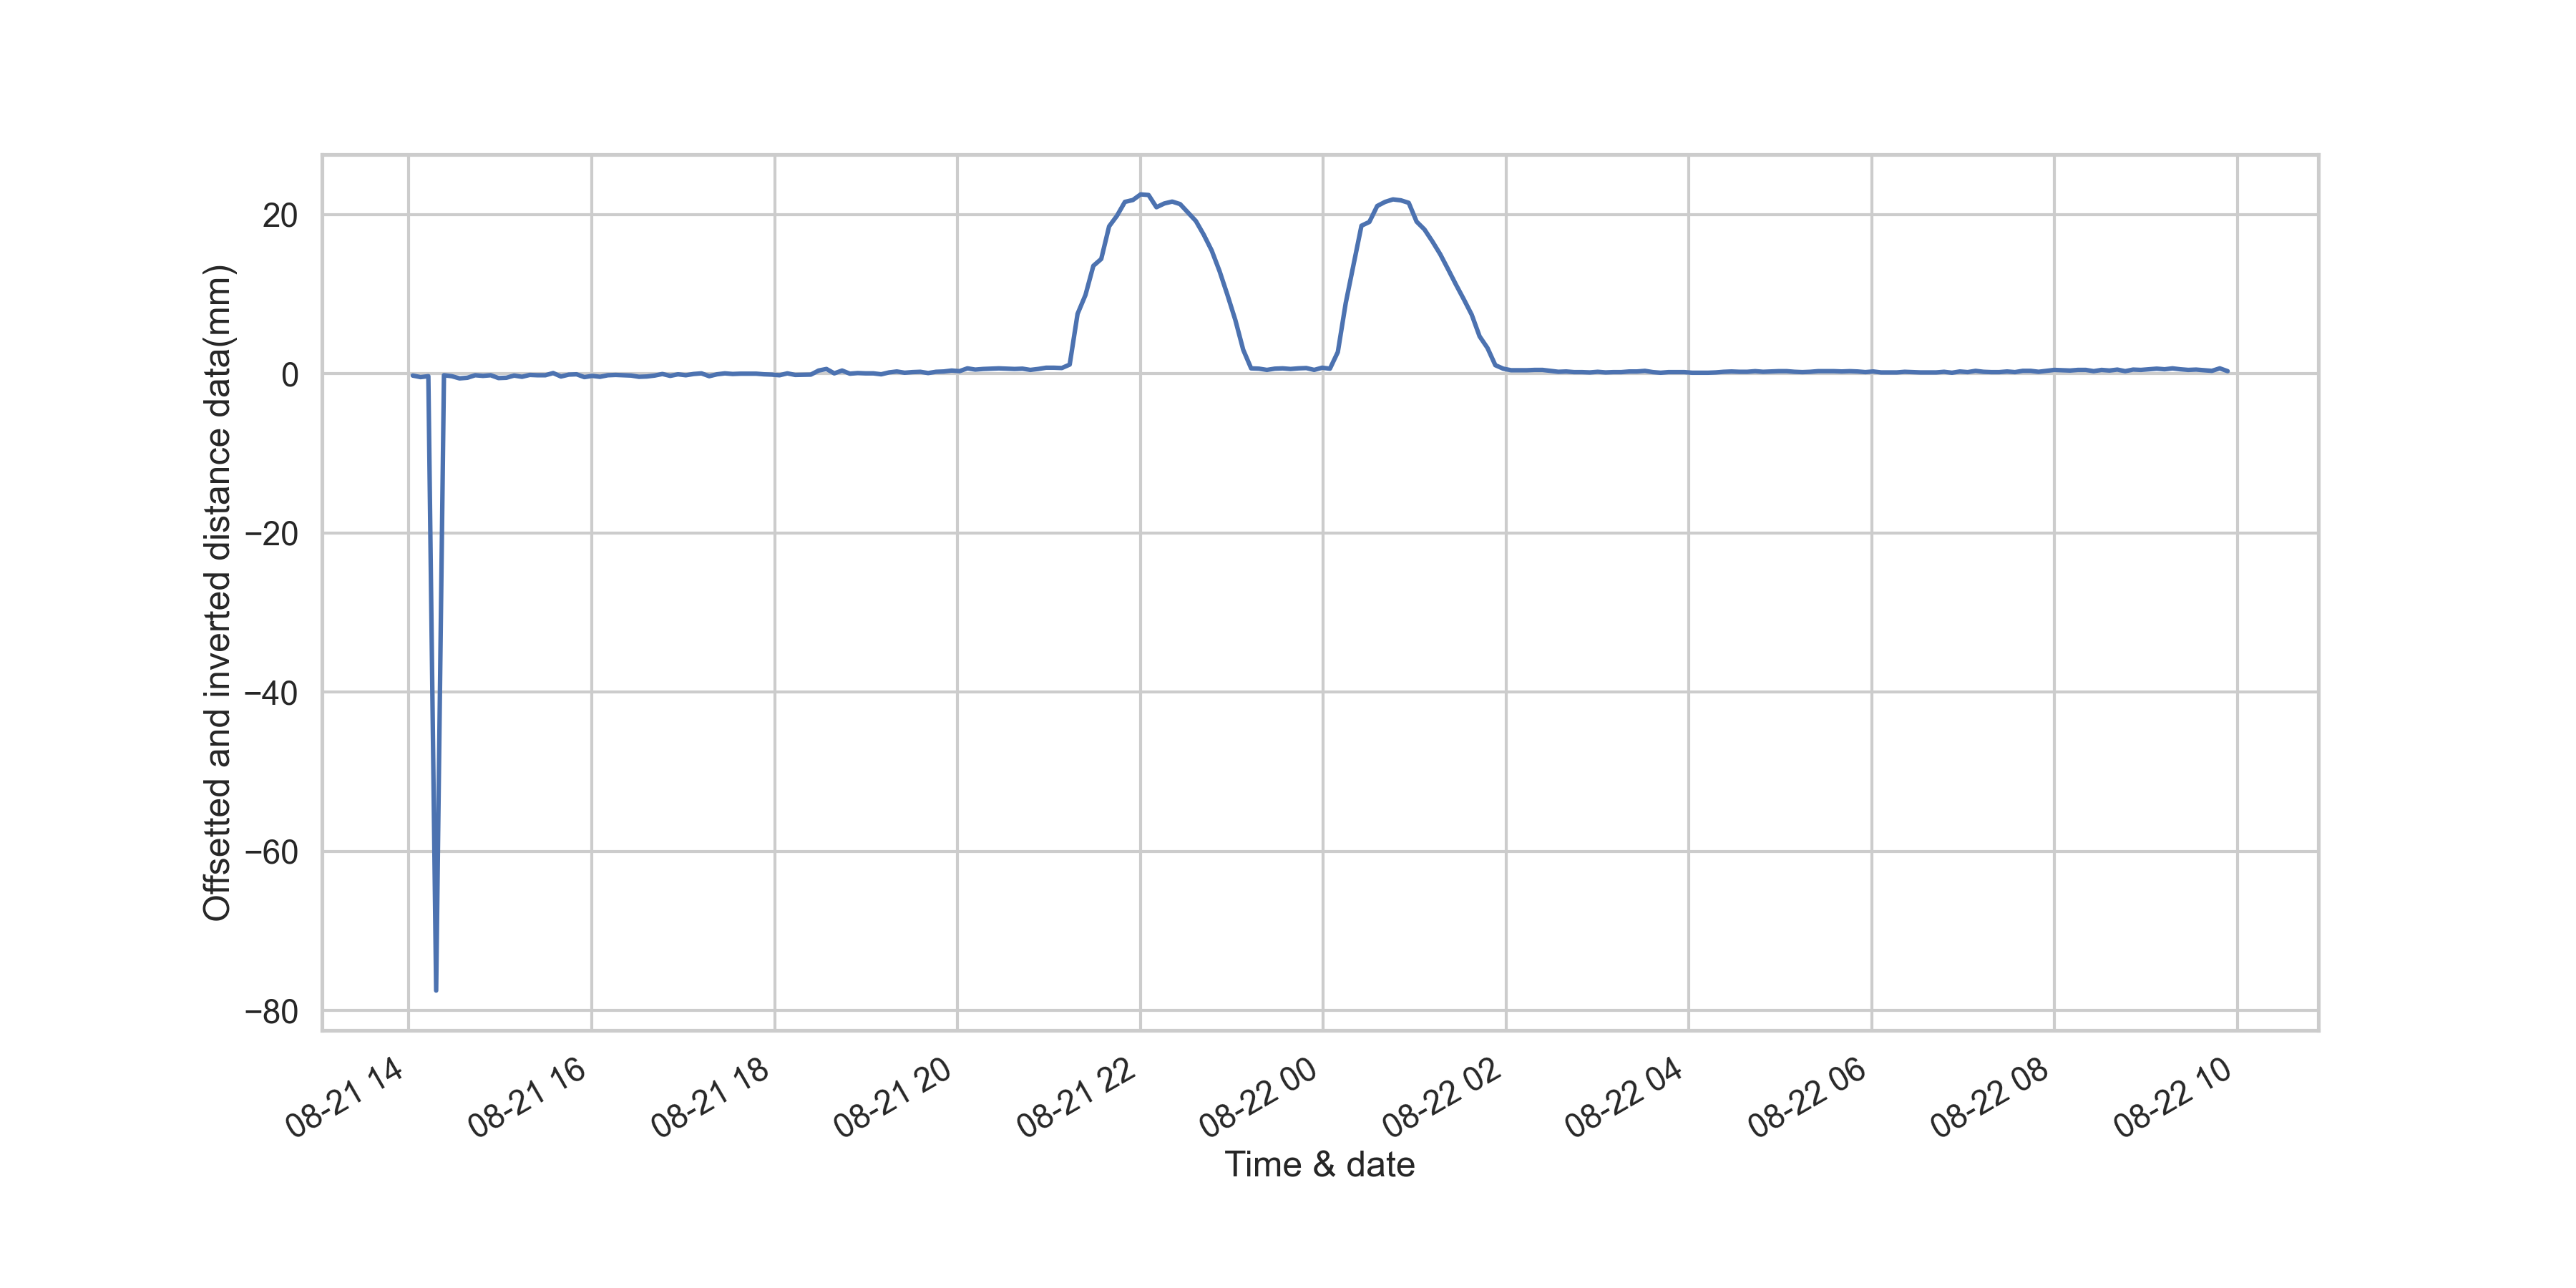
Now the baseline when there is no flood is around 0 and the depths are above this baseline.
Erroneous Depth Data Filter
The flood depth data is further filtered to remove noise without losing the important flood-data characteristics such as timing, duration, depth, and the flood profile. Data filtering involves the following steps:
-
Gross Range Check:
The range of the raw distance measurements are based on the sensor model and its range. For example, 30mm - 5000 mm ranging sensor can only measure distances between these intervals. However, after installing the sensor at a known installation height, assuming the profile of the sidewalk’s surface is constant, this range now becomes 30mm - installation height. Hence any measurement outside this new range is discarded.
-
Spike Check:
Spikes in the depth data can be caused by external agents such as animals, humans or any other object large enough to be detected by the sensor. The sensor takes the median of 5 measurements for every uplink to minimize these spikes. Furthermore, the spikes leads to a different profile compared to that of flood and are omitted.
For example, the alerting system calculates the rate of change of successive depth measurements. This rate of change of depth measurements is slow and different for a flood compared to that of any other object because a gradual raise of the water surface corresponds to a gradual increase in the depth measurements. Where as an external object causes a very large rate of change and the alerting system does not flag these measurements as a flood.
-
Noise Check:
Since the sensor working principle is based on the speed of the sound, the ultrasonic sensor measurements are influenced by the same factors - temperature, humidity, direct sunlight, wind etc that influence the speed of sound in air. This noise is around 1% of the measurement or 1 inch when installed at 2.5 meters. Due to solar radiation during the day, the temperature of the housing changes and the measured depth deviates from the actual depth by this noise floor. This deviation is caused by error in the temperature compensation. Therefore the depth measurements that lie within this noise floor are filtered out.
Data Storage - InfluxDB
Every data passed through this pipeline is finally stored in InfluxDB database with a timestamp at which the data is logged.
Offset Calculator
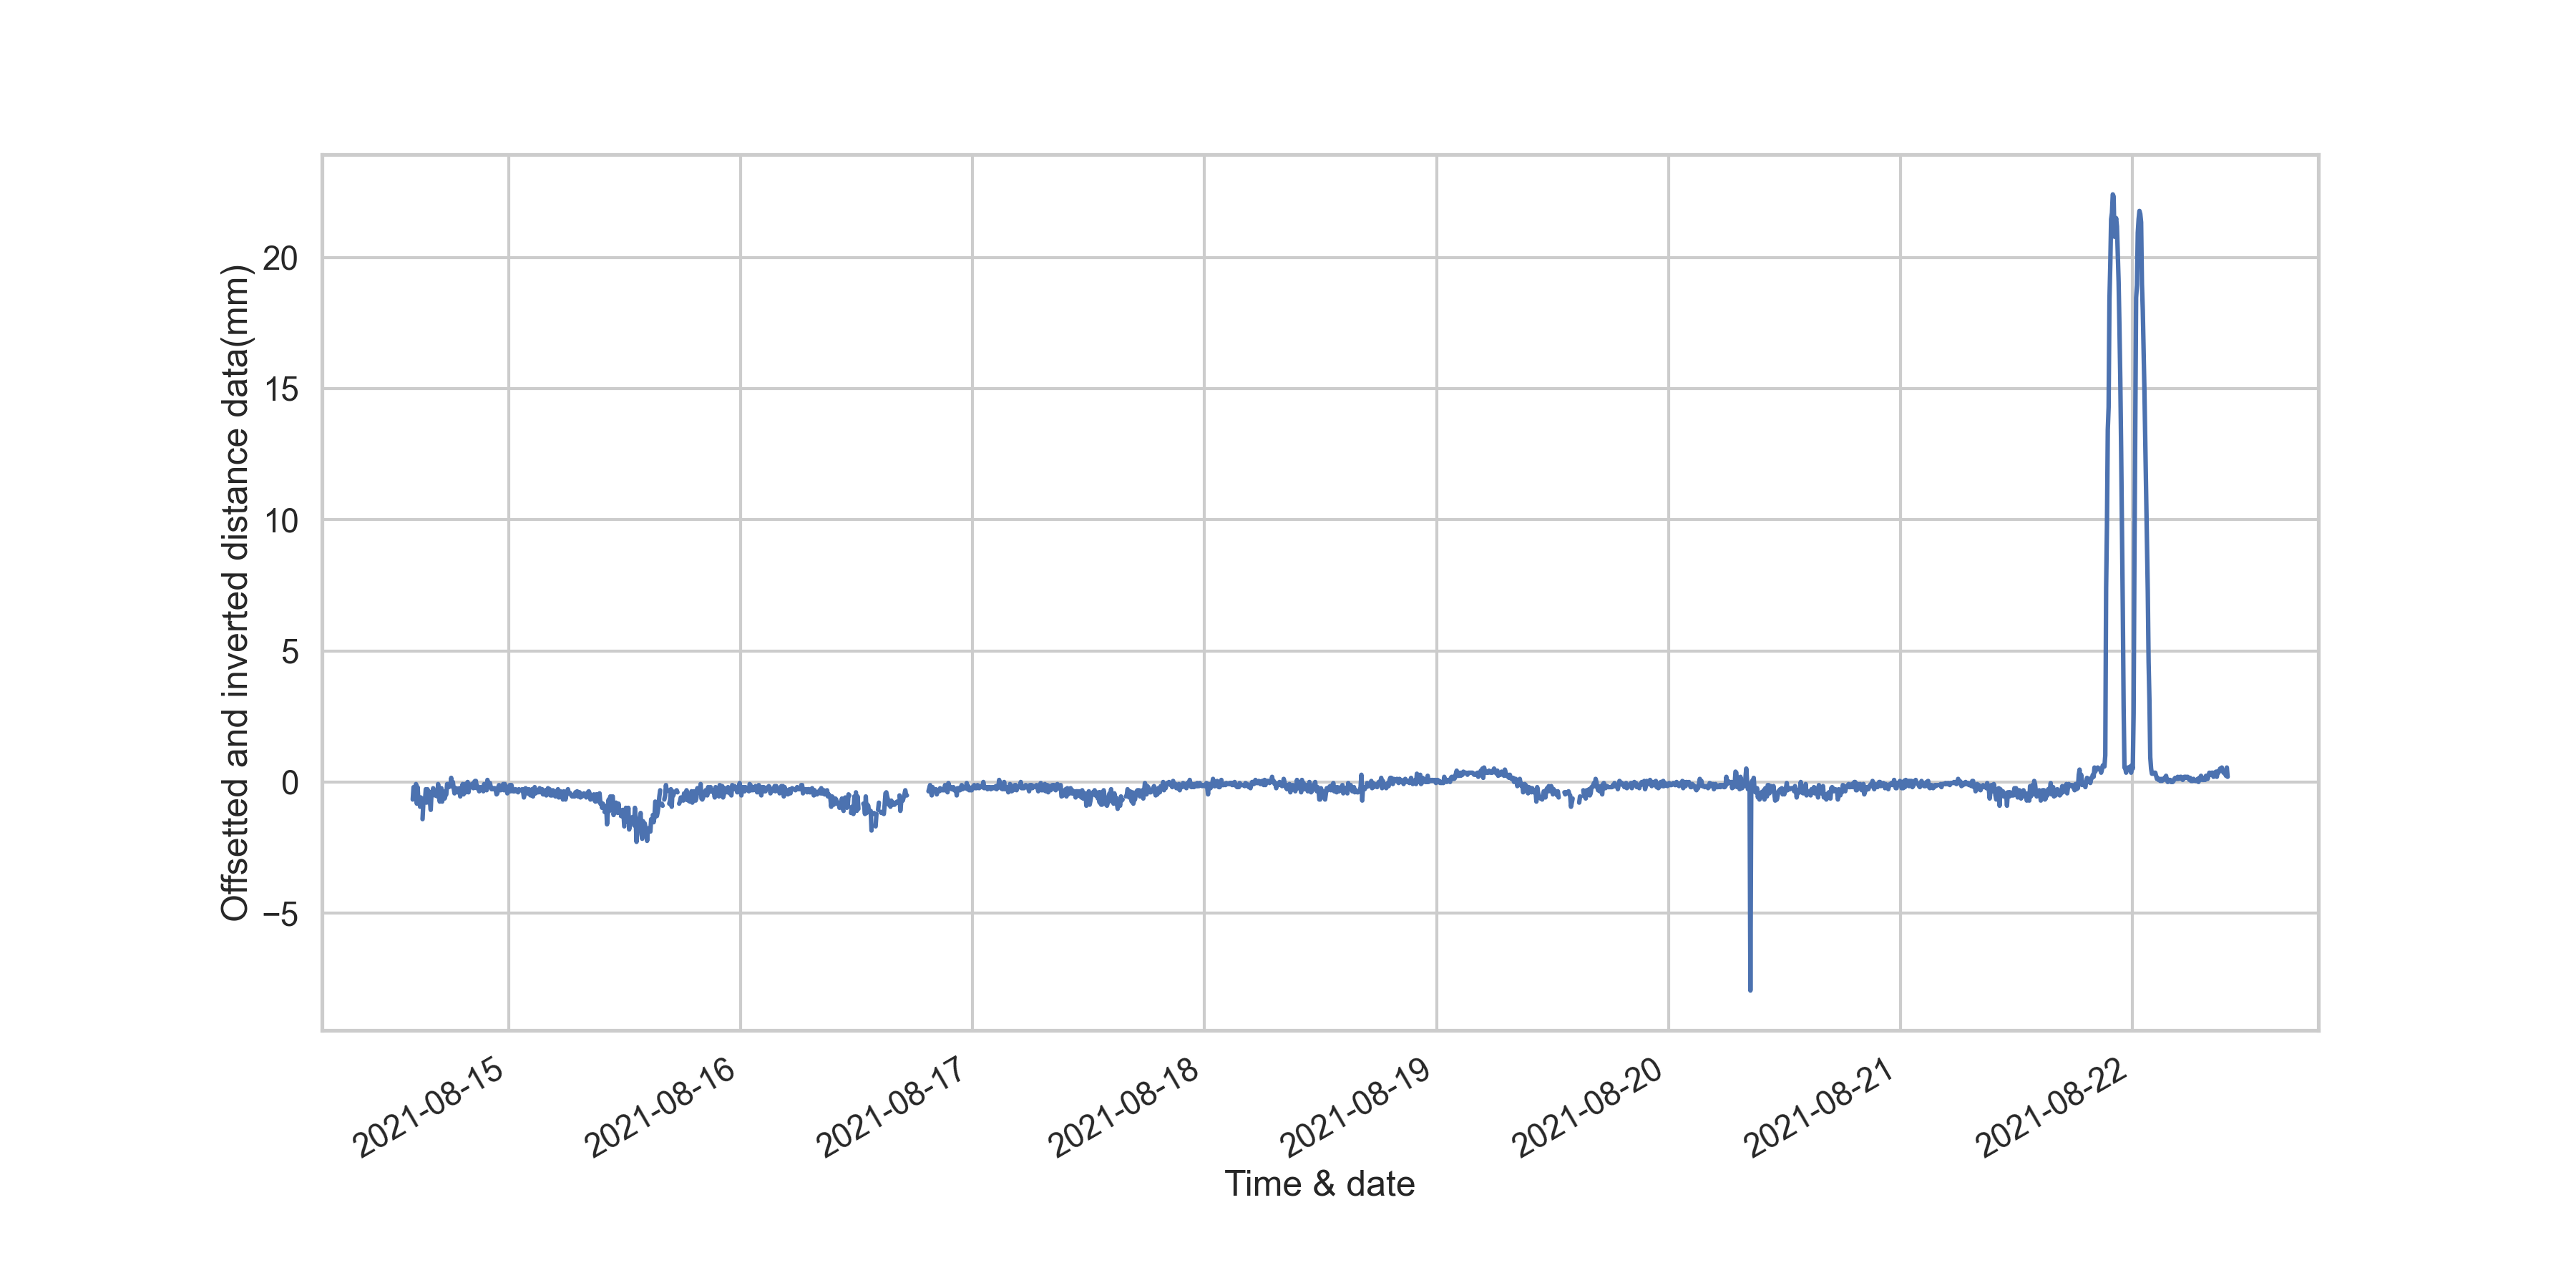
The raw distance data has anomalies during the daytime due to inaccurate temperature compensation of the sensor in direct sunlight. These anomalies are in the opposite direction of the depth measurements as shown in below figure
When converted to depth, these anomalies appear below the surface which the sensor is looking at. Since the sensor is usually mounted above the sidewalk, the actual distance between the sensor and the sidewalk is constant. Also, during the night times, these anomalies are not observed and sensors data is most stable.
Every night at 11:30 pm, the offset is estimated for every sensor by calculating the median of last 7 days night time data. The following figure shows the transformed depth values
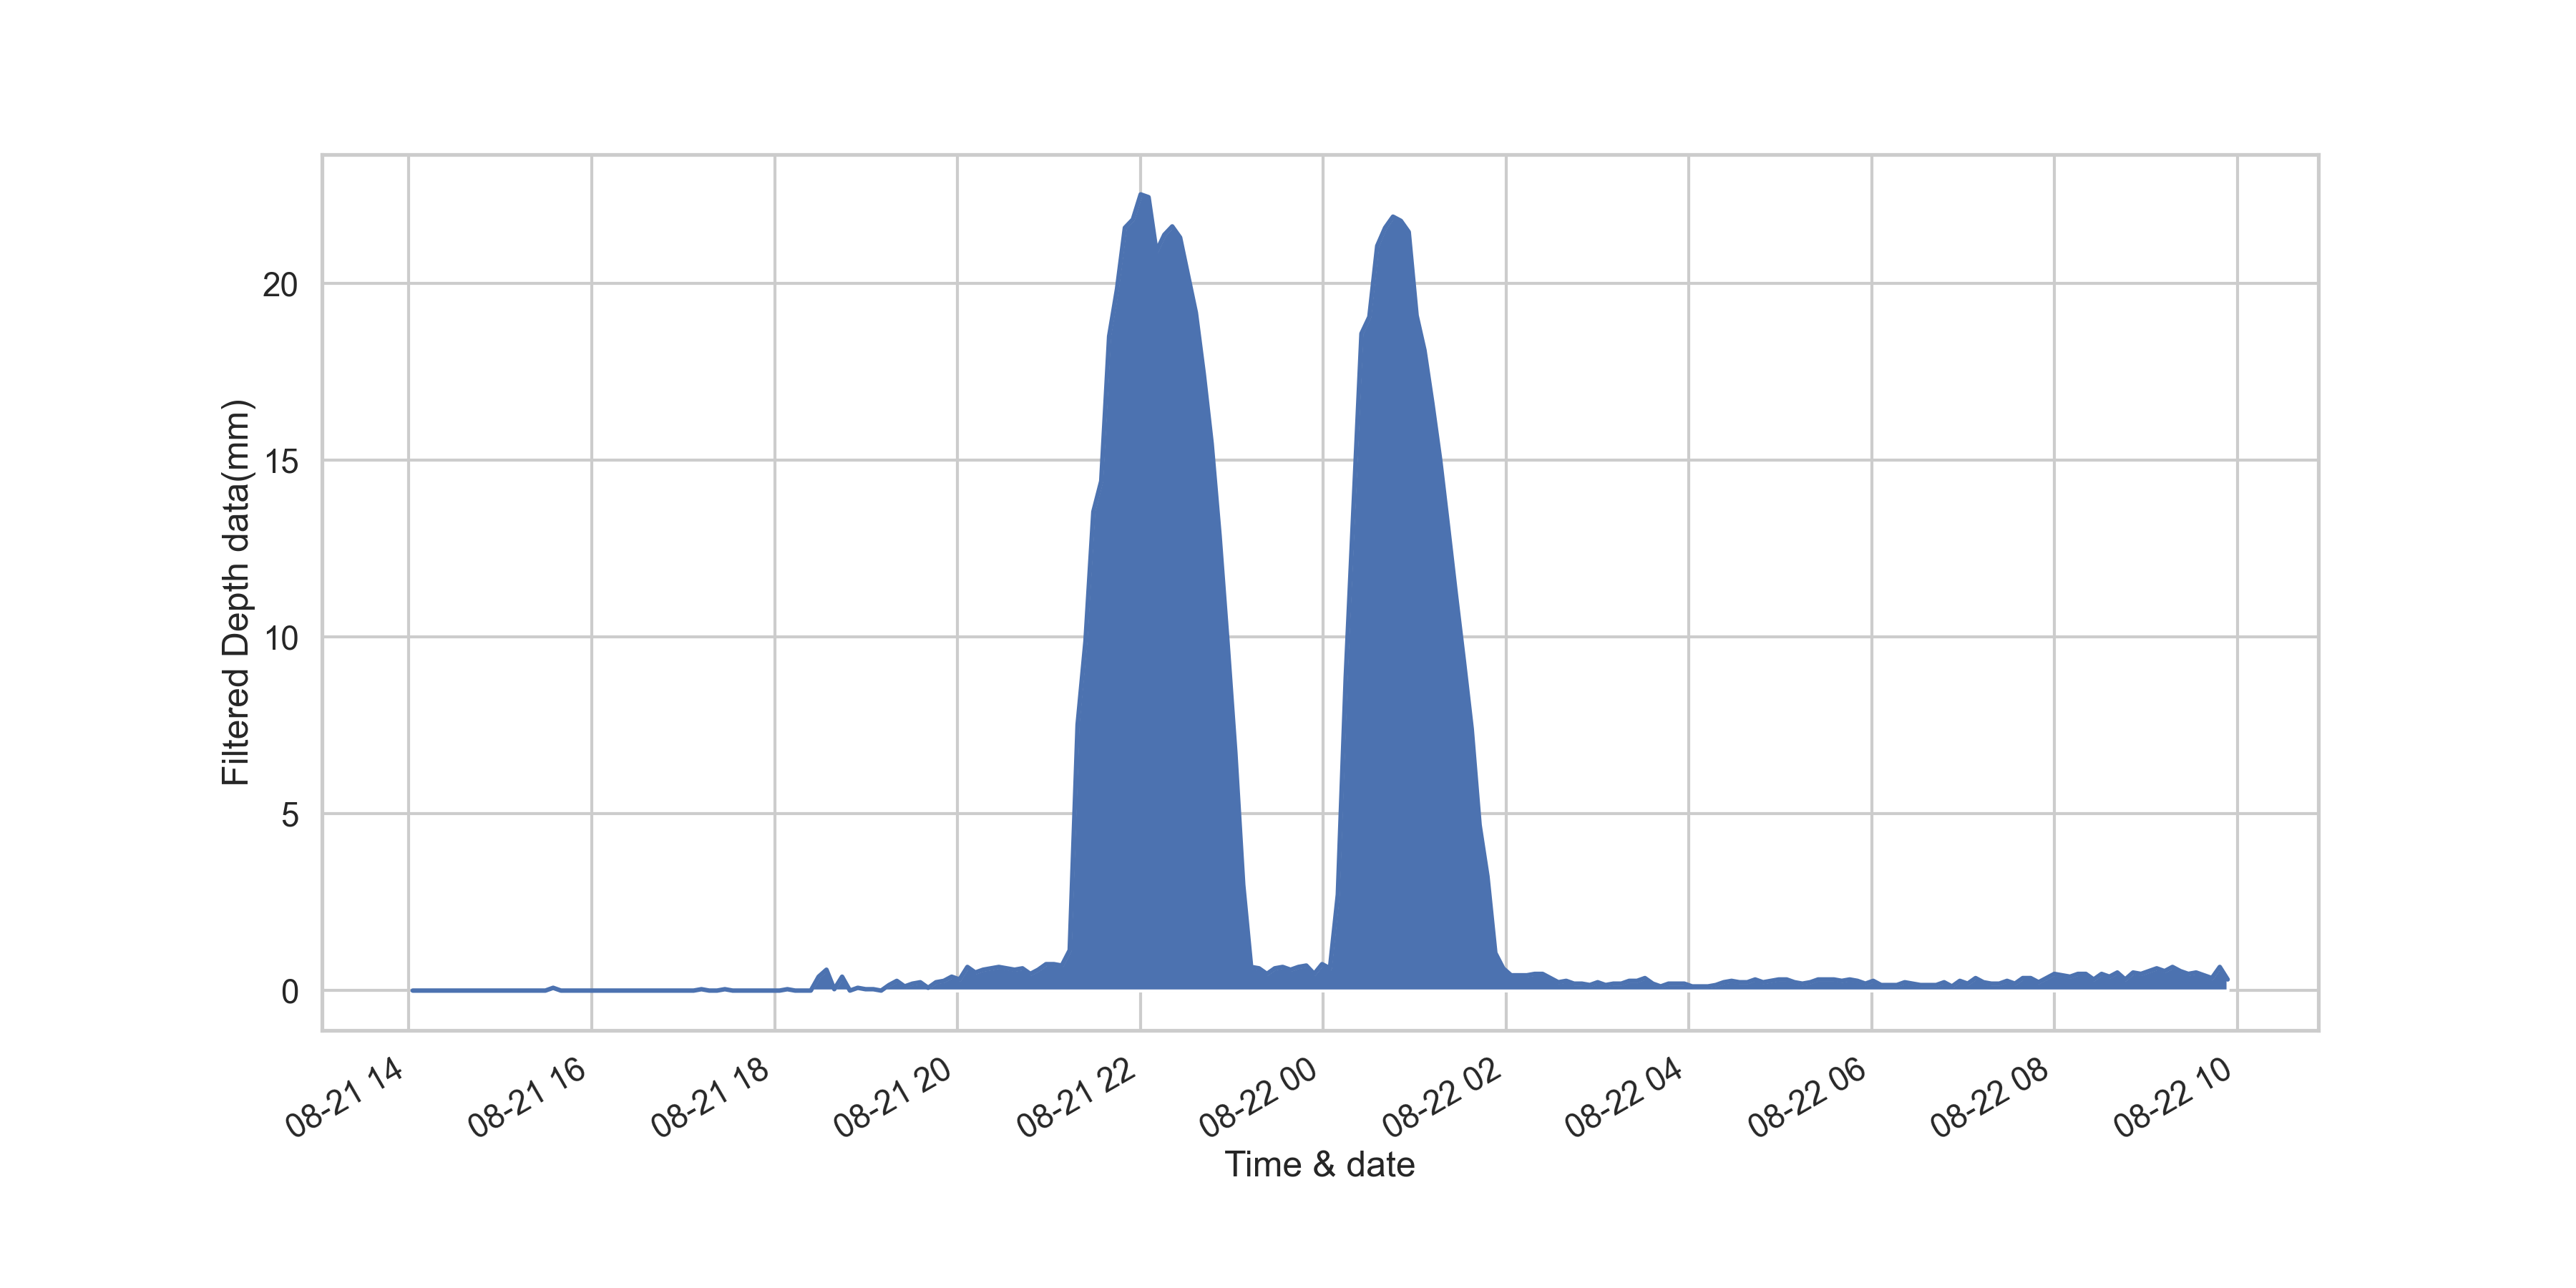
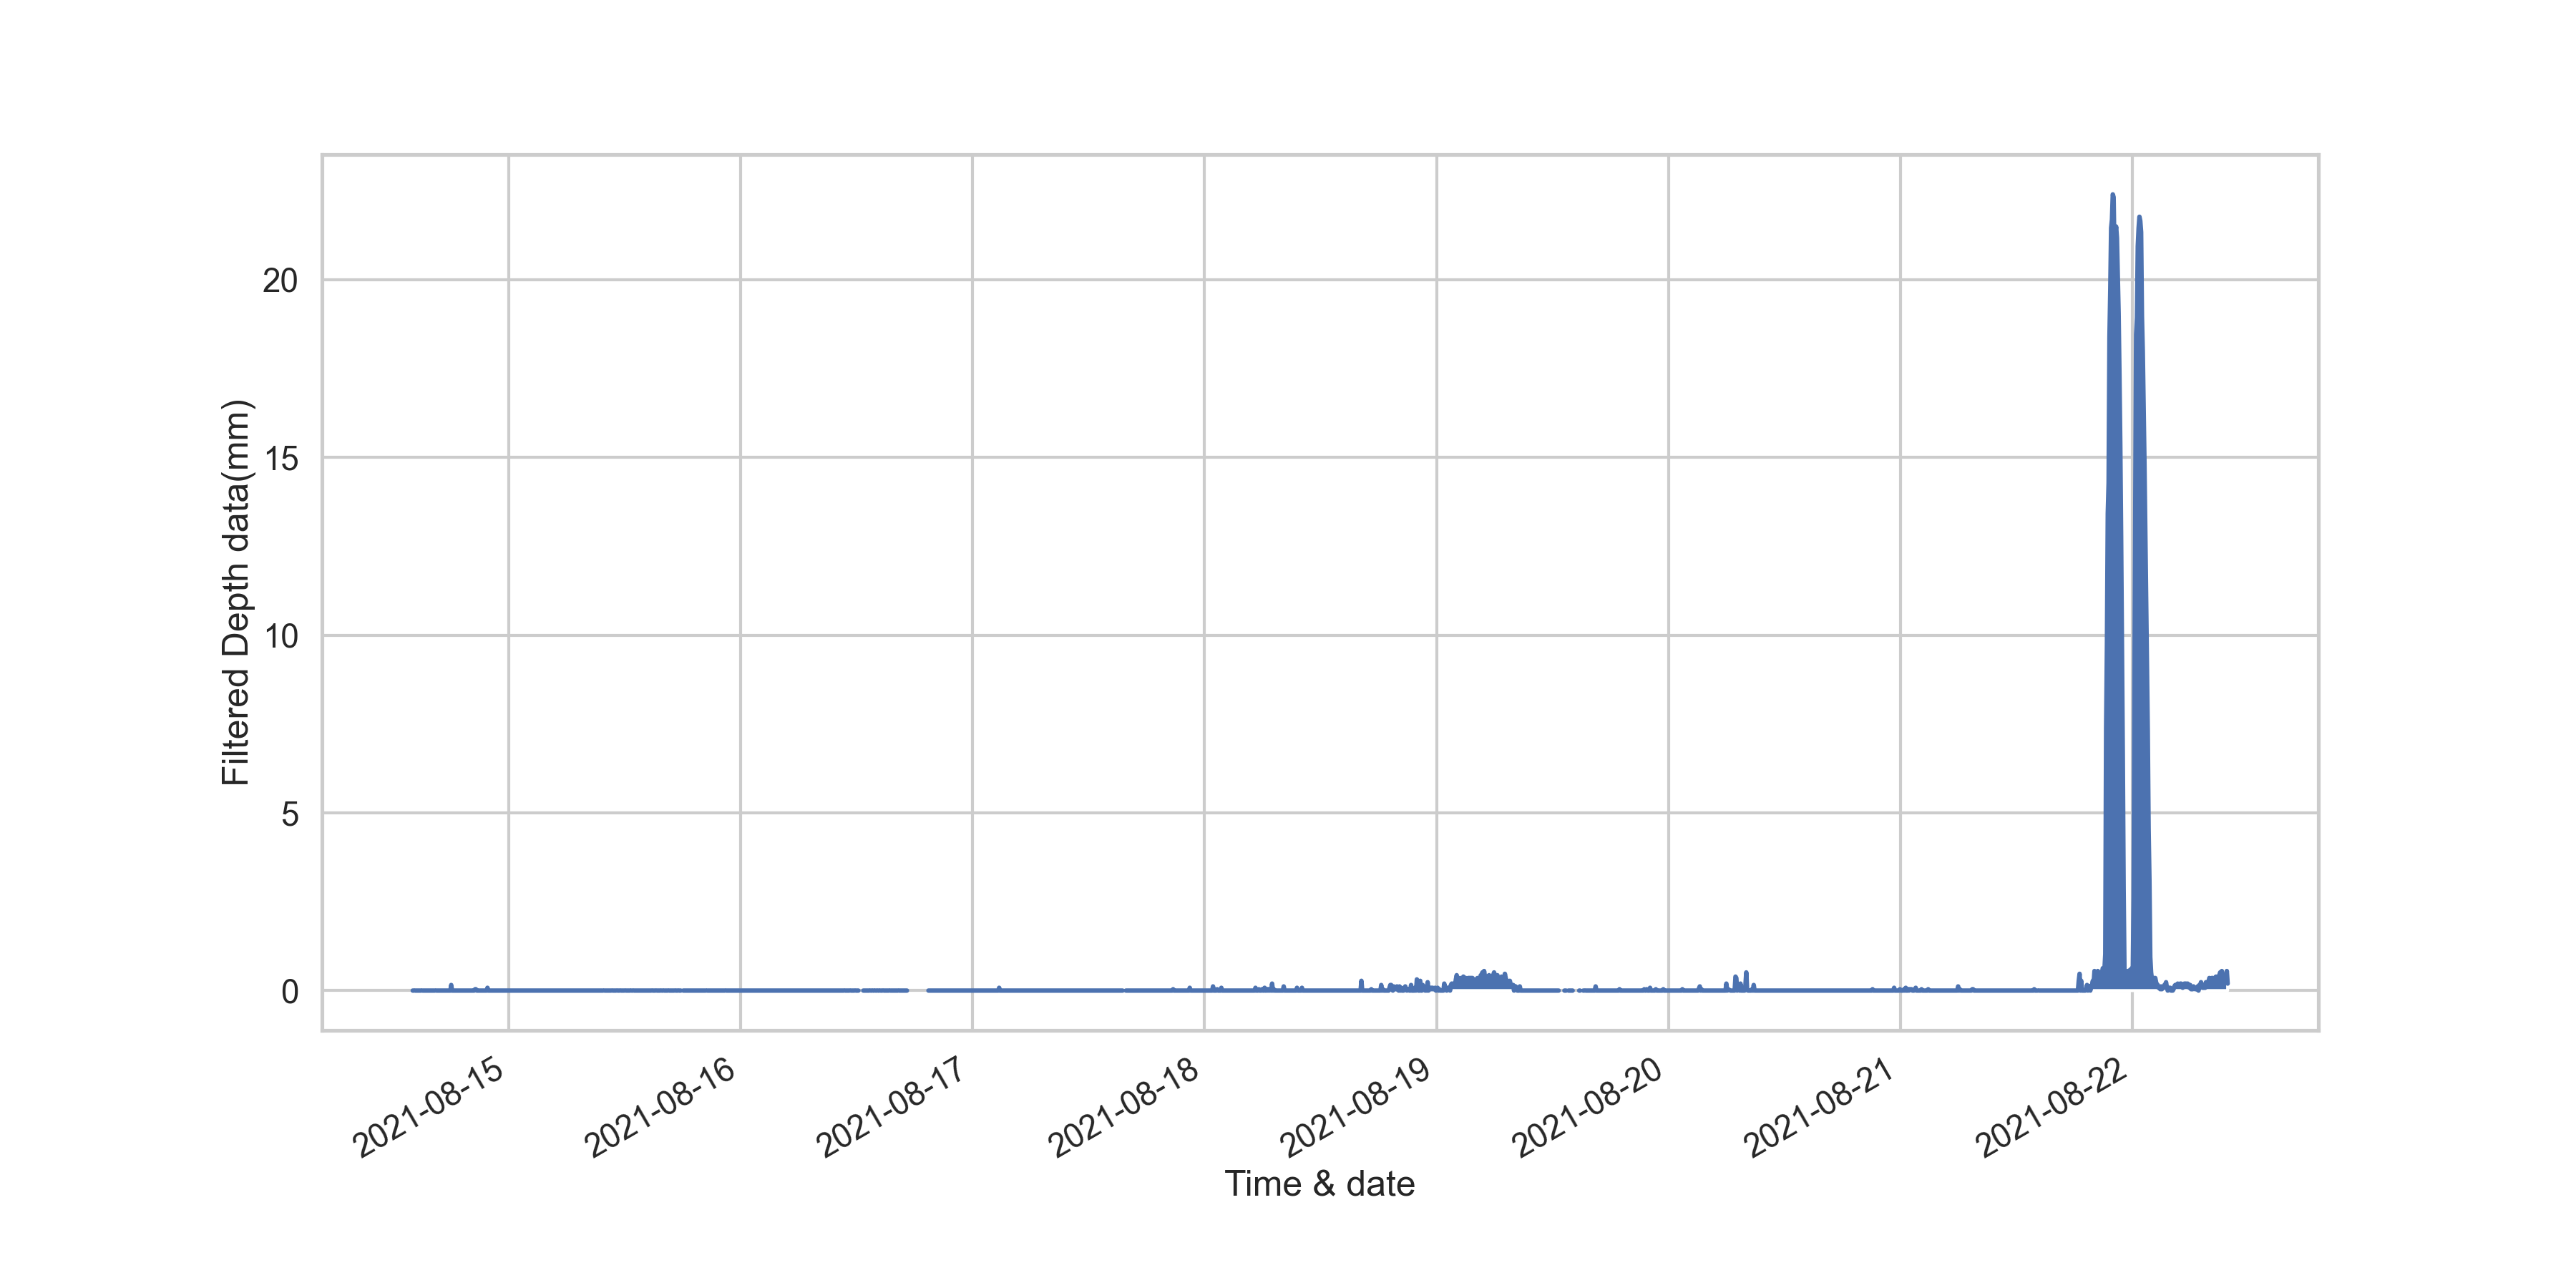
The depth values cannot be negative and they are further filtered to get more stable data in a no-flood condition and the following figure shows such transformation.
References
- U.S. Integrated Ocean Observing System, 2021. Manual for Real-Time Quality Control of Water Level Data Version 2.1
- NWS Techniques Specification Package (TSP) 88-21-R2 (1994)
- Maxbotix HRXl-MaxSonar -WR Datasheet
- New York City Department of Transportation Traffic Signal Standard Drawings
- New York State Standard Sheets
- LoRaWAN Class A Devices